My previous article detailed just how far Canada is falling behind the US in the climate fight. This article explores how Canadians can get back on track.
Five years ago, Prime Minister Stephen Harper pledged that Canada would match American efforts in cutting climate pollution. Today, America is on track to meet its part of our shared 2020 target. Canada isn't.
Now in the run up to the global Paris 2015 conference, the world expects all major climate polluting nations to announce even deeper emissions cuts for 2030. The US has already promised to double the speed of their cuts.
In contrast, Canada, the world's tenth largest climate polluting nation, lacks a plan to meet its promises. Instead emissions are projected to rise into the future. The pressure is growing rapidly for Canadians to do their fair share in the climate fight. But how?
What is causing climate failure in Canada?
The data is crystal clear as to what is driving our climate failure.
The Alberta tar sands (aka oil sands or bitumen) is causing three-quarters of the climate pollution gap between Canada and the USA.
The path to climate success is equally clear.
If the tar sands did their fair share with their own emissions, then Canada would be close to the Americans and within striking distance of both current and required future climate targets.
Take a look.
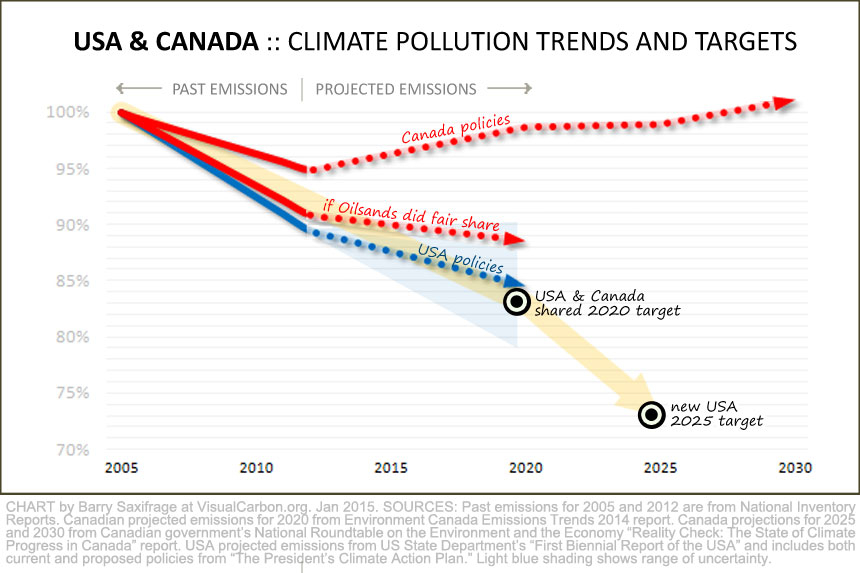
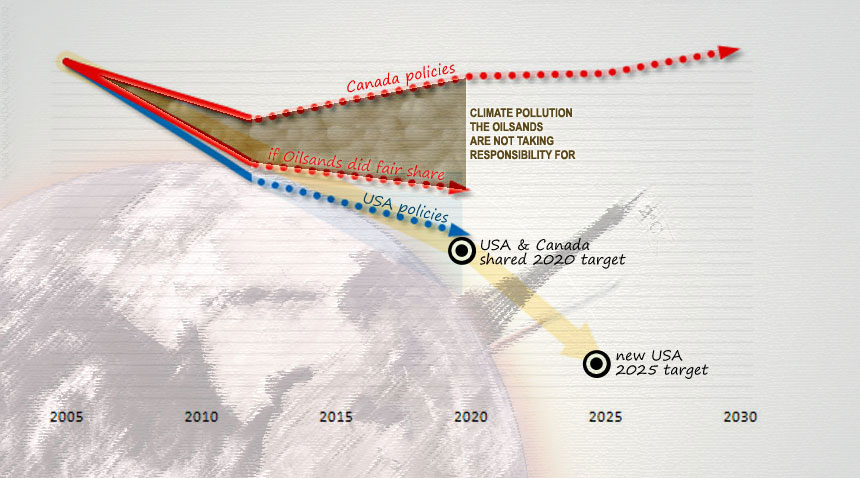
CHART: Climate pollution changes and targets for USA and Canada relative to 2005. Solid lines are past emissions. Dotted lines are each nation's projected emissions. Bull's eyes are official climate pledges. Chart by Barry Saxifrage.
My chart above shows two possible climate paths for Canada: falling emissions or increasing failure. Here is the story it tells.
USA path to climate success
The bottom blue line shows American's past and projected emissions. The solid blue part shows that so far the Americans are on track to meet the shared goal. The light blue cone shows a range of possible emissions from US climate policies depending on several uncertainties such as how quickly policies can be fully implemented. The dotted blue line is their best estimate.
Canadian path to climate failure
The top red line in the chart shows the current situation where the tar sands industry is failing to do their fair share to handle their own emissions. Tar sands emissions have surged 80 per cent higher since 2005. The solid red part shows that Canada is already lags behind the Americans and is not on track to our shared goal. The dotted red part shows federal government projections for Canadian emissions under all existing and proposed policies. Emissions are expected to rise far into the future with no decline in sight.
Canadian path to climate success
The lower red line in the chart shows Canadian emissions if the tar sands did their fair share handling their own emissions.
What is a "fair share?"
In this scenario, "fair share" means simply that the industry cuts or offsets their own emissions at the rate Prime Minister Harper promised that Canadians would do so: 17 per cent below 2005 levels by 2020.
The tar sands industry wouldn't need to cut all of their fair share of climate pollution themselves. But they would need to take responsibility for whatever they didn't cut, by paying others in Canada to make those cuts instead.
As it is, the tar sands are forcing others in Canada to clean up after them.
The fair share path in the chart shows Canada keeping pace with America's success, and within striking distance of our shared 2020 goal. Some additional climate policies will still be needed in other parts of the Canadian economy, but success is certainly possible...unlike now.
In this fair share scenario, Canada would stay in harmony with America, the European Union and other advanced economies in the fight to prevent dangerous climate changes. Even Norway, with a population and oil production level similar to Alberta's, has promised to cut emissions to 40 per cent by 2030. The foot-dragging days of dump and run are running out.
Tar sands climate pollution in context
Sadly, the tar sands are doing the very opposite of their fair share. The next two charts highlight the gigantic scale of their surging pollution levels.
CHART ONE: Percent changes in climate pollution
My first chart shows the percent change in Canadian climate pollution since 2005. Notice anything?
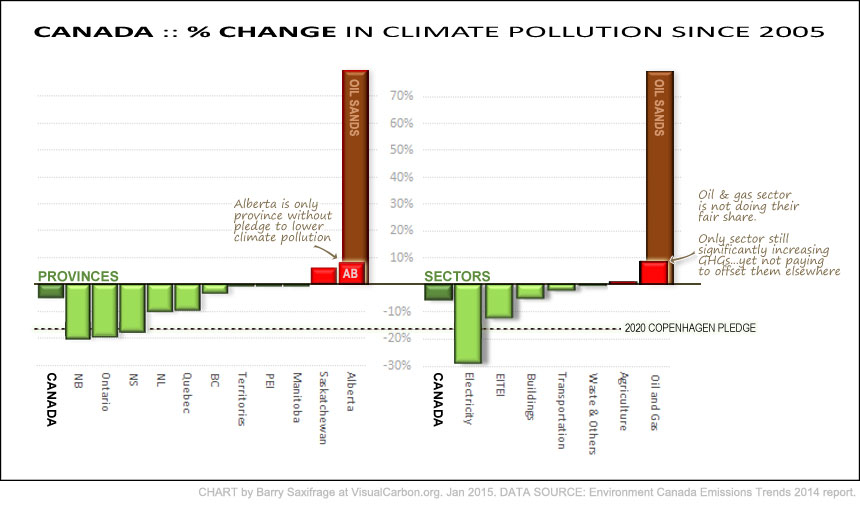
CHART: Percentage change in Canadian climate pollution since 2005. Chart by Barry Saxifrage.
The tar sands industry -- instead of pulling their own weight in the climate fight by reducing or offsetting their emissions -- have increased their emissions by 80 per cent in just seven years.1
In contrast, several Canadian provinces cut climate pollution in line with Canada's commitment. Perhaps surprisingly, even Alberta, outside of their tar sands industry, cut emissions by nearly five per cent. But when the tar sands surging pollution levels are included, Alberta's emissions rose seven per cent instead.
The same pattern shows up at the sector level. Many sectors made emission cuts. The only sector to significantly increase emissions was the oil and gas sector -- up nine per cent in seven years. However, once again we see that if the oil sands had been doing their fair share, then the oil and gas sector emissions would have fallen 10 percent.2
CHART TWO: Mega-tonne changes in climate pollution
My next chart shows the same information, but this time in millions of tonnes of climate pollution (MtCO2).
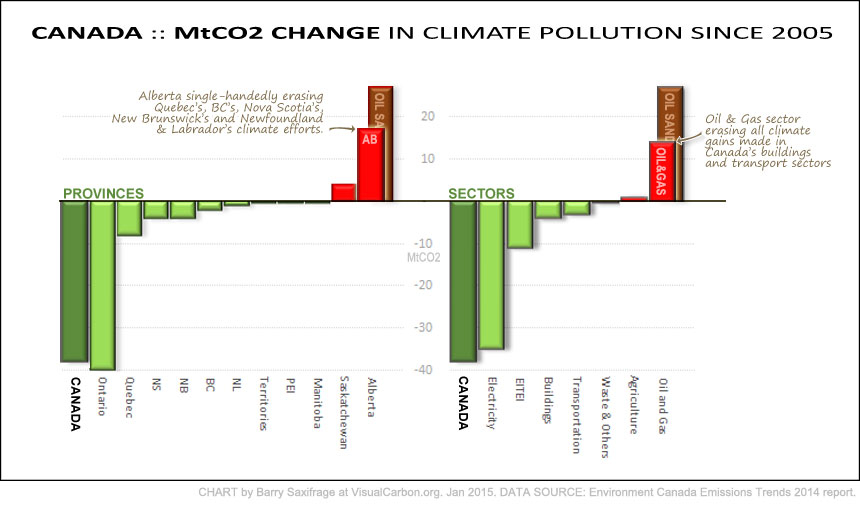
The same pattern emerges: surging tar sands emissions are wiping out climate efforts in much of the rest of Canada.
Most provinces and economic sectors have been reducing emissions. The only two big exceptions -- Alberta and the oil and gas industry -- again would have also reduced emissions if the tar sands industry had done their fair share by reducing or offsetting their own emissions.
But the tar sands haven't been doing their fair share.
Instead the industry has rapidly increased their climate pollution while expecting other Canadians to take responsibility for it.
To me that is both wildly unfair and a clear recipe for national climate failure, which is exactly the mess we are in now.
To appreciate the scale of the tar sands unfair share, consider that the industry's surge in climate pollution has single-handedly erased all the climate progress made by:
- Quebec,
- British Columbia,
- Nova Scotia,
- New Brunswick,
- Newfoundland & Labrador, and
- a big chunk of Ontario's.3
At the sector level, the oil sands' failure to reduce or offset their emissions erased all the climate progress from the Canada's transportation, building, and emission-intensive, trade-exposed industrial sectors.4
The 2020 chasm between fair and unfair
By 2020 the climate pollution chasm between fair and unfair with tar sands emissions could be more than all the coal burning in Canada.
Here's the math. In 2005, the tar sands emissions were 34 MtCO2. Under current unfair policies, the government expects tar sands climate pollution to hit 103 MtCO2 per year by 2020. If instead the industry did their fair share, then their net emissions would amount to 28 MtCO2 in 2020.
The difference by 2020 between the tar sands "dumping responsibility onto others" versus "taking responsibility" is projected to be an extra 75 MtCO2 per year. 5 For context that would be:
- three-quarters of Canada's projected climate gap with the Americans.6
- more than all the coal burning in Canada7
- more than British Columbia's entire emissions.8
That is a pretty big dump and run.
Maybe Canadians will decide that a polluter of this scale should pay their fair share to clean up their own mess.
Next up: The number that changed everything
My next article in this series will dig into the game changing concept and science behind humanity's remaining "2oC Carbon Budget". It is a story of a geeky number that went "wickedly viral" and is radically changing the fight for a safe climate future.
The article after that returns to the tar sands to see how the industry's expansion plans might fit into or more accurately, blow out -- Canadians' remaining safe-climate carbon budget.
Notes and sources
Canada and USA's joint pledge is to cut climate pollution 17 per cent below 2005 levels by 2020. The tar sands' fair share would be to do the same with their own climate pollution. Whatever cuts they don't make themselves they would pay others in Canada to make instead.
Here is how the math works out. All Canadian data is from Environment Canada Emissions Trends 2014.
2005: Climate pollution from the tar sands industry was 34 MtCO2 in the 2005 base year.
2012: Climate pollution from the tar sands industry was 61 MtCO2 in 2012 (the most recent year available).Their fair share at this mid-point would be 31 MtCO2 (8.5 per cent below 2005). The tar sands are 30 MtCO2 above their fair share so far. That is 74 per cent of the gap between Canada and USA in 2012.
2020: Climate pollution from the tar sands industry is projected to be 103 MtCO2 in the target year of 2020. Their fair share would be 28 MtCO2 (17 per cent below 2005). The tar sands are projected to be 75 MtCO2 above their fair share. That is 72 per cent of the projected gap between Canada and USA's middle estimate for 2020.
For scale, BC annual emissions today are 60 MtCO2. Manitoba's are 21 MtCO2. Quebec's are 78 MtCO2. All coal burned in Alberta causes 44 MtCO2 a year.
1 See Environment Canada Emissions Trends 2014 for most of the data used in these charts.
2 See discussion in the notes above that show tar sands current "fair share" is 30 MtCO2 below actual 2012 emissions. The Emissions Trends 2014 report shows that the oil and gas sector increased emissions by 14 MtCO2 over that same period (2005-2012). If the tar sands had reduced, or offset in the sector, their fair share, then the oil and gas sector emissions would have fallen 13 MtCO2 over the period.
3 As discussed in notes above, tar sands were 30 MtCO2 above fair share in 2012. Emissions reductions over this period by Quebec, British Columbia, Nova Scotia, New Brunswick and Newfoundland & Labrador totaled 19 MtCO2. All data from Environment Canada Emissions Trends 2014
4 As discussed in notes above, tar sands were 30 MtCO2 above fair share in 2012. Emissions reductions over this period by transportation, building and emission-intensive,trade-exposed Industrial sectors totaled 18 MtCO2. All data from Environment Canada Emissions Trends 2014
5 As discussed in detail in the notes above, tar sands 2020 projected emissions are 75 MtCO2 above their fair share. Fair share would be matching national commitment to cut emissions 17 per cent below 2005 levels.
6 As discussed in notes above, tar sands 2020 projected emissions are 75 MtCO2 above their fair share. Canada would need to cut 104 MtCO2 to match the percentage cut the Americans expect by 2020 in their middle scenario. The tar sands excess above their fair share accounts for 72 per cent of that projected gap.
7 As discussed in notes above, tar sands 2020 projected emissions are 75 MtCO2 above their fair share. All emissions from burning coal and natural gas to generate electricity in all of Canada is projected to be 71 MtCO2 in 2020. Today in Alberta electricity production emits 44 MtCO2. Coal's share of that is roughly 38 MtCO2. Data from Canada's National Inventory Report 2012 part three.
8 BC emissions are currently around 60 MtCO2.


Comments