If we care about the environment and the negative effects of climate change, then we are all policymakers to some extent. Our domain might extend to only ourselves or our family, or perhaps our workplace, neighbourhood, or municipality.
On a larger scale, implementing climate policy is a tough job being attempted by provincial, territorial and federal politicians and staff.
Over the next weeks, I will write columns discussing the challenges policymakers face and provide step-by-step plans for meeting goals. We'll introduce a new methodology to tackle climate change mitigation decisions and a set of tools to guarantee that the results we want are actually met.
Mitigation strategy for policymakers: Module 1
Over the past few months, there has been an enormous worldwide shift in the public discussion about climate change. What has changed is not what climate deniers are now saying, it is what they are not saying.
Public claims by climate change deniers have virtually stopped. This tipping point is similar to cigarette manufacturers that finally admitted, after decades of fierce denial, that their product caused cancer. Why now?
The discussion among climate scientists in peer-reviewed journals has been clear and growing for the last 25 years. Scientists characterize the evidence as unequivocal and incontrovertible that human activities are causing climate warming. But in the speeches of some politicians and on social media, climate change denial was still rampant until about 18 months ago.
Then something interesting happened. Analysis of the effects of reduced economic activity during the COVID-19 pandemic revealed that CO2 in the atmosphere was reduced as fossil fuel usage decreased during the same period. It then quickly rebounded as economic activity resumed, putting a lie to claims that human activity does not affect CO2 levels.
Then, at the UN climate talks (COP28) in December, even the oil-producing nations led by the petrostate United Arab Emirates admitted to the same reality. Today, although you can find old claims by climate deniers repeated online, newer claims have mostly disappeared.
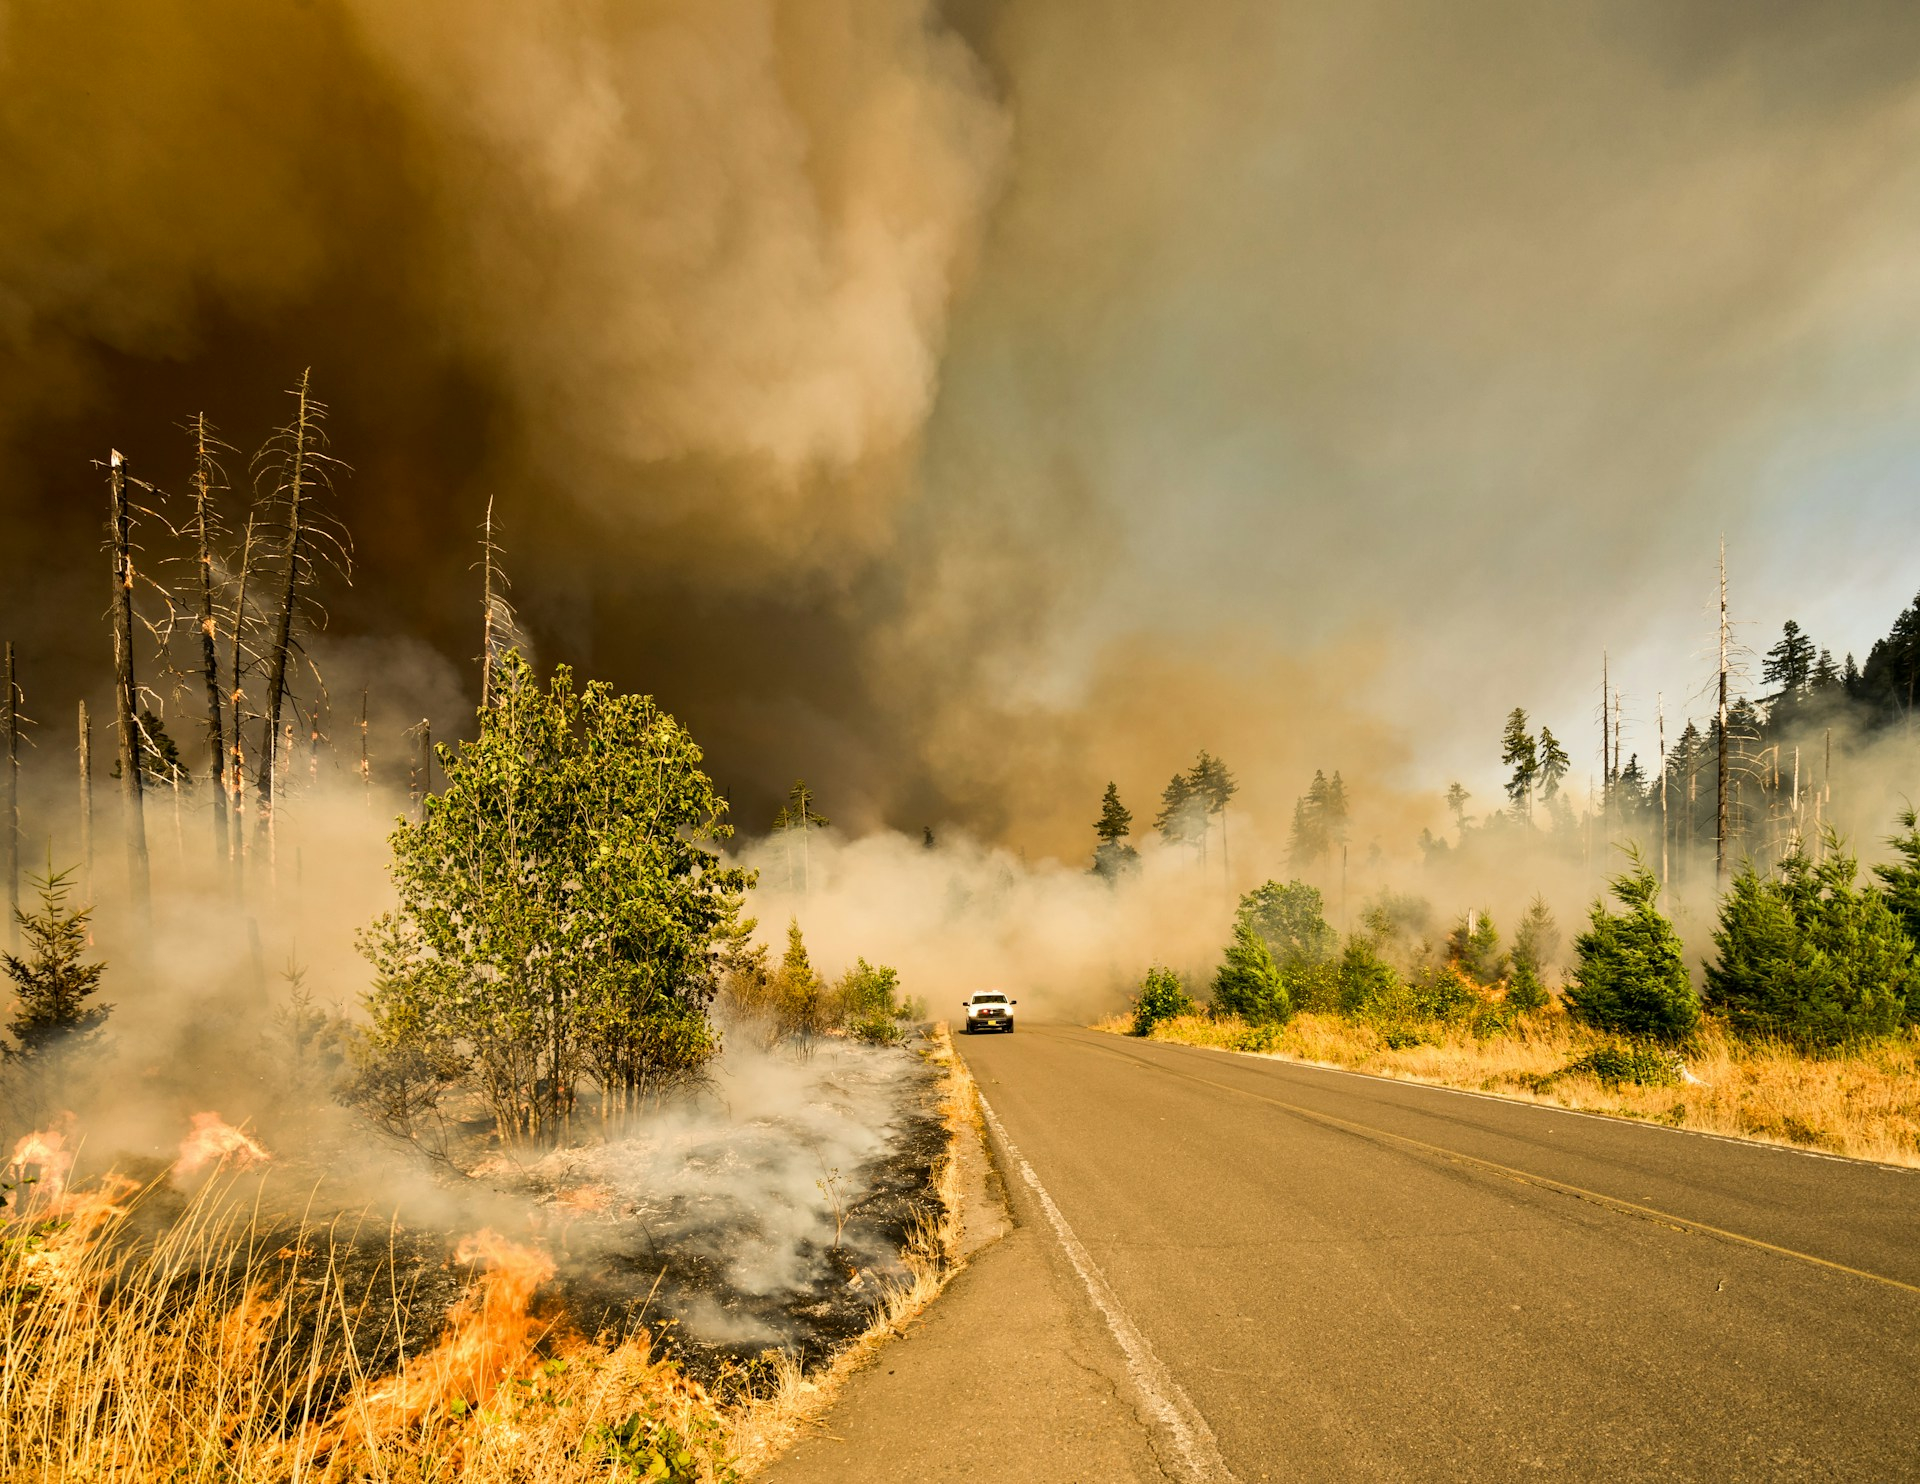
Without the constant barrage of climate change denialism, the public is becoming increasingly attuned to the harmful effects of climate change. People are also increasingly receptive to governmental policies in line with the UN goal of keeping the world's temperatures from rising more than 1.5 C by 2050. In Canada, last summer's devastating wildfires further cemented the reality of climate change in the public's consciousness.
The federal Liberal government, to its credit, released a plan in March 2022 describing how the country could reduce its greenhouse gas emissions by 40 to 45 per cent by 2030 compared to 2005 levels. The 2030 Emissions Reduction Plan is consistent with the United Nations Intergovernmental Panel On Climate Change’s (IPCC) goals. Its plans are ambitious in terms of its targets. In terms of its results, however, it is far behind.
The key numbers of Canada's plan show how much greenhouse gas emissions for each sector of the economy — like transportation, oil and gas and building heating — must be reduced so that the country as a whole will fall to 443 megatonnes of greenhouse gas emissions by 2030. (Remember that number, as it will guide the evaluation of Canada's emissions reduction efforts over the coming years.)
However, the government's plan contains a glaring omission — it does not include the steps each province and territory must take to achieve that goal.
A charitable description of the current situation is that Canada's emissions reduction plan has gotten off to a slow start. Some provinces like B.C. are moving ahead on their own, while others like Alberta are thumbing their noses at the federal plan, and most of the rest are struggling without clear direction from Ottawa. A less charitable description is that Canada's plans are in disarray.
But there is good news: Setting up step-by-step plans is relatively easy. At the University of Saskatchewan, we've devised all the necessary tools. We've set up a methodology each province and territory can follow so that everyone can pull together, and this will be described in these weekly columns.
The rather basic first step was for the feds to set targets for each province and territory. They recently did so, almost two years after the plan was first published. Hence, the provinces’ and territories' slow start.
Now, the targets are published and presented in a usable interactive format online. This web page allows you to enter a particular province or territory (like Alberta) and the sector of emissions you are looking at (like oil and gas), and you can see the historical numbers from 2005 to 2021 and the projected goals through 2035. Directions: After going to the web page link, click on the "detailed greenhouse gas emissions projections" tab above the visualization, then select the box for Alberta (as you can see in the screen grab below), and then click the box for oil and gas. This will be the result:
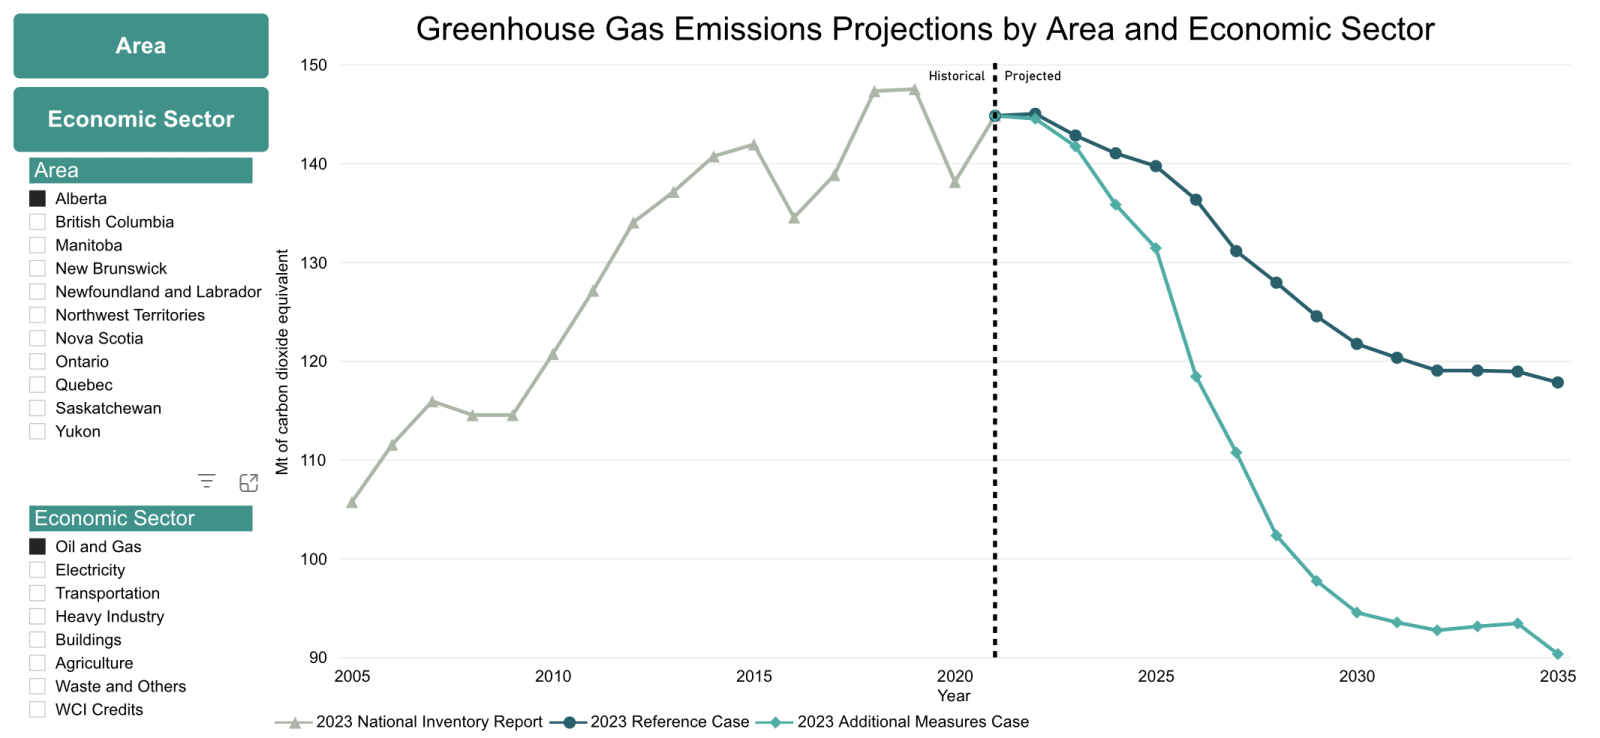
The nifty part is you can now click on any province or territory and any economic sector and see the history and projections for that particular area.
On the right, you'll see a black line, the Reference Case, and a green line, the Additional Measures Case. This is where it gets interesting and will be the subject of next week's column, Mitigation Strategy For Policymakers: Module 2.
Hal Segal is part of the Interdisciplinary Studies PhD program at the University of Saskatchewan. He can be reached at: [email protected]

- Hal Segal
- Hal Segal
Keep reading


"This web page allows you to
"This web page allows you to enter a particular province or territory (like Alberta) and the sector of emissions you are looking at (like oil and gas), and you can see the historical numbers from 2005 to 2021 and the projected goals through 2035."
The arithmetic around emissions is undercut by the fact that Canada's O&G industry grossly underreports its emissions (of all types).
Also, the federal government grossly miscalculates emissions from the forestry industry. Ottawa's creative accounting turn a net carbon source on the scale of the AB oilsands into a carbon sink.
"Canada should close the logging gap in its climate plan" (National Observer, May 9 2023)
https://www.nationalobserver.com/2023/05/09/opinion/canada-should-close-...
In short, Canada's emissions stats are fiction. Reporting on actual emissions cuts must be taken with a large grain of salt.
You cannot manage what you do not measure.
Hi Geoffrey, this reply is
"Analysis of the effects of
"Analysis of the effects of reduced economic activity during the COVID-19 pandemic revealed that CO2 in the atmosphere was reduced as fossil fuel usage decreased during the same period. It then quickly rebounded as economic activity resumed, putting a lie to claims that human activity does not affect CO2 levels."
Inaccurate. CO2 (concentration) in the atmosphere was not reduced during the pandemic. CO2 emissions were reduced, which is not the same thing. Human activity still generated a huge volume of emissions, but less than in previous years. 2020 emissions still boosted atmospheric CO2 levels.
Conduct the following experiment:
Put a 5 kg bag of sugar on the weigh scale. Read the weigh scale. Now put another 5 kg bag of sugar on the weigh scale. And then another. Read the weigh scale.
Now add a 4.5 kg bag of sugar.
Did the reading on the weigh scale go up or down?
A 7% decline in emissions in 2020 over the previous year still represents a huge volume of carbon added to the atmosphere. A massive addition, not a subtraction.
2020 emissions were equivalent to emissions around the year 2000. Did atmospheric CO2 levels go up or down in 2000?
"Global shutdowns related to the ongoing coronavirus (COVID-19) pandemic reduced particulate air pollution in many areas, allowing more sunlight to reach the surface and producing a small but potentially significant warming effect. These shutdowns also appear to have reduced the amount of CO2 emissions last year, but overall CO2 concentrations continued to increase, and since warming is related to cumulative emissions, the overall amount of avoided warming will be minimal." (NASA)
Deniers make all sorts of goofy claims. The notion that human activity is not responsible for the rapid increase in atmospheric CO2 (but that some other source must be) was never a climate myth of any import.
Denialist "arguments" centered on the effect of increasing CO2; whether other factors (e.g., the sun) were responsible for warming; and even whether the world was in fact warming.
Cool.
Cool.
I think the graph setup thing is pretty interesting. But, the particular projection it's showing, of emissions from Alberta oil and gas, I suspect will decline more drastically than that. IMO by 2035 demand for oil and gas will be in serious decline, leading to ongoing low prices for crude, making tar sands oil plays operate at a loss. So tar sands oil will stop emitting, because it will shut down. Some of the normal oil will still be viable, but I'm not sure there's all that much left.
Comments