Support strong Canadian climate journalism for 2025
"It’s put-up or shut-up time. Canada must finally meet its targets, while growing the economy at the same time." — Globe and Mail editorial
I think most Canadians would love to see our nation meet its climate commitments while also improving our standard of living. And I'm sure it will be at the top the climate agenda this week as Prime Minister Trudeau meets with the premiers.
But is success possible on both fronts? To show where we are now and what's needed, I've illustrated our 2030 climate challenge in three parts below:
- First, what success looks like at the national level.
- Second, Canada's dramatic provincial divide that is complicating the hunt for a national solution.
- Third the widespread, yet little debated, policies that are locking in failure. These efforts to exempt the least productive half of our emissions from significant cuts need to be brought into the discussion if we are to succeed.
Okay, let's start the visual tour with our climate pollution.
Climate pollution. Success = 12.6 tonnes per Canadian
My first graphic shows the average climate pollution per Canadian. Each tonne is represented by a numbered black box.
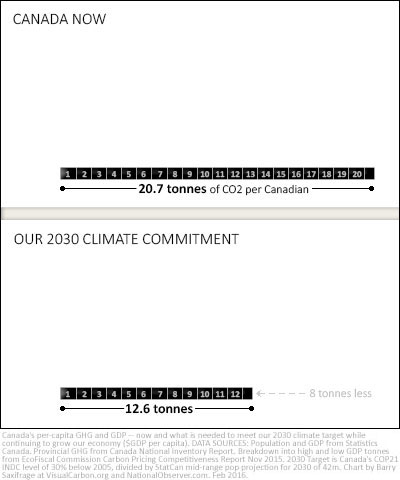
Today we average 20.7 tCO2.
To meet our climate commitment, we need to get down to 12.6 tCO2 by 2030.
That is eight tonnes less per person in fifteen years. For comparison, we cut 2.8 tonnes per person over the previous fifteen years. So clearly we will have to work a lot harder this round.
As the Globe and Mail pointed out in their editorial: "if the Trudeau government plans to meet those modest targets, it will have to take drastic action."
GHG Notes: All 2030 per capita estimates in this article are based on Statistics Canada's mid-range population estimate of 41.5 million Canadians in 2030. Canada's 2030 climate target is 524 MtCO2. Divided by 41.5 million Canadians = 12.6 tCO2 each.
Show me the money! Success = $4,000 per tonne
My next graphic adds in the dollar side of our climate challenge.
As the top panel shows, our Canadian economy currently produces around $45,000 in GDP per person. That's an average of $2,200 in GDP from each tonne of CO2. Climate geeks call this metric our "emissions efficiency". As we will see, the value of this will determine whether we succeed or fail.
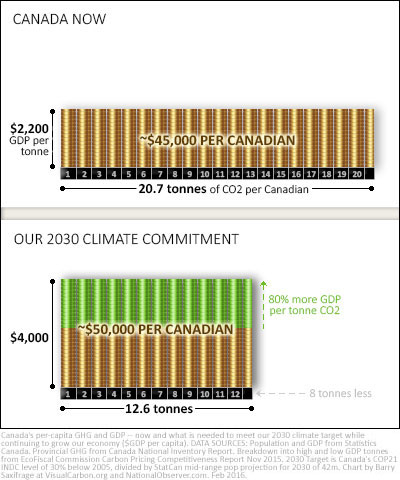
To accommodate our growing population and economy -- while also meeting our climate target -- we need to improve our emissions efficiency up to ~$4,000 in GDP per tonne by 2030.
The bottom panel illustrates what our dual success would look like: 12.6 tCO2 at $4,000 each = $50k per Canadian. The green coins show that we need to improve our emissions efficiency by eighty per cent to pull this off. For comparison, we improved less than half this much in the previous fifteen years. Once again it is clear that we need significantly stronger climate policies in this next round.
So, is our $4,000 target achievable?
The good news, as I'll detail below, is that almost all of our national economy is already close at $3,500 per tCO2. Our biggest climate challenge comes from our huge quantities of emissions that produce very little wealth per tonne. This emissions intensive slice of our economy pushes our national average for wealth-per-tonne way down to $2,200.
Below we'll see several scenarios showing how our climate success or failure depends in large part on how we treat this least productive half of our emissions.
For international comparisons, several European nations already exceed the $4,000/tCO2 we need to achieve by 2030. These include Italy that averages $4,300; UK at $5,000; France at $6,000; and oil producer Norway exceeding $7,500.
GDP Notes: All monetary values in this article are in 2007 dollars, so you can compare values without worrying about inflation. Also our 2030 target of $4,000/tCO2 and $50k per Canadian is a mid-range estimate. It could be as low as $3,600/tCO2 if we stay at $45k per capita. Or it could rise to nearly $4,300/tCO2 and $53k if we continue our recent trend of increasing our GDP per capita by around one per cent a year.
The provincial challenge
Now that we know what success looks like at the national level, let's drill down to the provincial level.
My next graphic shows how much climate pollution and GDP our five largest provincial economies produce. All other provinces are included together under the label "rest". As in the previous charts, the height of each coin stack shows how much wealth is produced per tCO2.
Here we can see how Canada is divided into two dramatically different types of carbon economies.
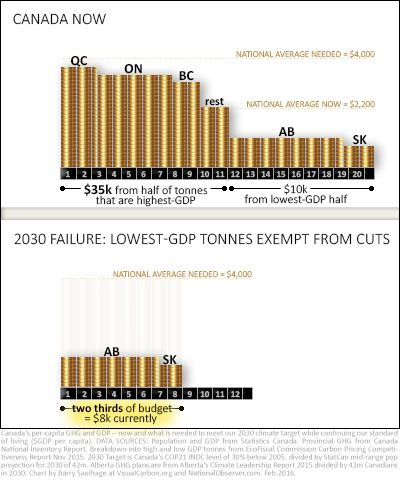
On one side, close to half our national emissions average $1,000 in GDP per tonne. This low-GDP half of our emissions comes from emissions intensive economies of Alberta and Saskatchewan.
On the other side, the remaining half of our national emissions average $3,200 per tonne. This high-GDP half of our emissions comes from all the rest of the provinces combined.
THE ROAD TO SUCCESS
There are many proposed ways to divide up the needed emissions reductions between the provinces. For example:
- by population;
- by historical emissions;
- by current emissions;
- by uniform carbon pricing.
Choosing a path to success that most fairly divides our needed emissions reductions is the subject of on-going debate.
THE ROAD TO FAILURE
However, there is also one widespread policy for dividing our emissions reductions that been absent for almost all discussions. And this policy is a sure path to failure:
- exempting the least wealth producing half of our emissions from significant reductions
The bottom panel in the graphic shows what this would look like. Two-thirds of our nation's carbon budget will be used up for our lowest-GDP emissions that collectively produce little wealth per Canadian. To make up for no cuts in this half of our climate pollution, all the other provinces would have to cut their emissions in half. That's a certain double fail.
THE CURRENT PLAN
This scenario isn't idle speculation. It's the current plan.
Alberta's new climate policies have received a lot of praise. But the bottom line is that Alberta's climate pollution is still projected to be higher in 2030 than it is now. As you can see in the chart above, Alberta is on track to single-handedly fill up half our climate budget with very low-GDP emissions.
And Saskatchewan has historically followed Alberta on their emissions trajectories. Saskatchewan's premier has become the most vocal critic of a shared national carbon price. If they model their climate policy and targets after what Alberta just did, then their emissions will also likely stay high.
And that's exactly the scenario of "no reduction in the lowest-GDP half of our emissions" illustrated above. While this particular scenario is real trouble for Canada, there is a far more dramatic one that involves almost all our provinces…
Hard truth: "emissions intensive" = low GDP per tonne
A recent report by Canada's Ecofiscal Commission and Navius Research divides each provincial economy into two groups based on how "Emissions Intensive, Trade Exposed" (EITE) they are. My next graphic shows the breakdown into "less exposed" sectors (gold coins) and "more exposed" sectors (red coins). Notice that every provincial economy has some of each.
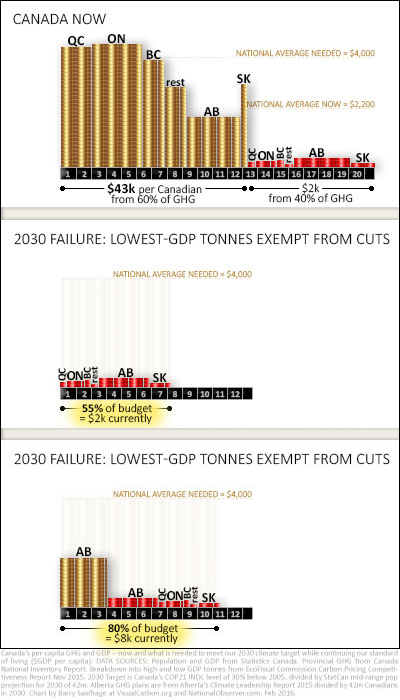
The top panel shows that the gold coin sectors provide 95 per cent of our GDP. These sectors have high-GDP emissions that average $3,500/tCO2.
The red coin sectors provide the remaining five percent of our GDP. These EITE sectors have very low-GDP emissions that average only $275/tCO2. They emit thirteen times more climate pollution to produce each dollar of GDP.
THE ROAD TO FAILURE
The middle panel shows what happens if we exempt our EITE sectors from having to make any significant emissions cuts. By 2030, their extremely low-GDP emissions will take more than half our nation's carbon budget to produce less than $2k per Canadian (at their current emissions efficiencies).
DOUBLE TROUBLE
Amazingly, it gets worse. The bottom panel shows what happens when we combine the provincial and EITE sector scenarios. Now eighty per cent of our carbon budget gets used up by our nation's least productive emissions.
These scenarios clearly show how the polices that exempt the least productive half of our emissions from significant cuts lead to dramatic and on-going failure. When you consider that our nation's climate pollution budget has to keep shrinking towards zero, the need to start acting on these low-GDP emissions is even more compelling.
THE CURRENT PLAN
One again, this scenario is what is currently planned. A common feature of provincial climate policies is the explicit effort to shield their EITE (red coin) emissions from significant climate action. Here are just three recent high-profile examples.
- Alberta expects their least wealth producing emissions (EITE) to substantially increase through 2030 even under their new climate policies. Alberta already emits half of Canada's EITE emissions. And the rapid growth in this class of emissions has been the main driver of our national climate failure so far. And yet their new climate policies specifically exempt their EITE emissions from almost all carbon pricing via free pollution permits. Sure enough they keep going up.
- British Columbia also plans to significantly increase their EITE emissions through 2030. The province is actively pursuing a new industrial policy that will cause a surge in the province's low-GDP emissions. Like Alberta, BC's proposed 2030 climate policies specifically shield their EITE emissions. BC plans to spend over half of all their new carbon tax revenues – up to $2 billion per year -- to protect their rapidly expanding EITE sectors. That's more than double what these EITE sectors currently pay in carbon tax.
- Ontario's EITE sectors currently create a quarter of all provincial emissions to produce two per cent of their GDP. Ontario's new 2030 climate policy specifically exempts these EITE emissions from climate action for several years.
These are just a few of the many efforts to exempt, and even expand, the hundreds of millions of tonnes of our least productive emissions.
THE HARD CHOICE
There are good, non-climate, reasons why provinces want to shield their EITE emissions from cuts. At the same time there are also good climate reasons for why we can't keep shielding the least-productive half of our emissions from making significant cuts in their pollution.
We are going to have to change something.
Perhaps a new economic test is needed to guide our decisions on emissions. One that starts to measure and prioritize the amount of wealth produced per tonne of climate pollution.
Team Canada's gold line and red line
Since this topic is both unfamiliar and loaded with complicated terms, I'm going to try explaining the high level decision we face by using a hockey analogy.
Our national economy, "Team Canada", has two lines skating for it -- a red line and a gold line. Both lines reliably score goals, but at very different rates. The red line needs 13 times more minutes on the ice (13 times the tCO2) to score each goal ($GDP).
Our head coach, Justin Trudeau, now needs to decide what percentage of skating time (carbon budget) each line will get.
Can he afford to let his red line significantly increase their percentage of time on the ice? That's what is currently being proposed by exempting our least productive emissions from significant cuts.
Or will he decide to maintain the red line at their current percentage of the game? To do that, our least productive emissions will need cut emissions at the same rate as everyone else.
The international race for low-carbon wealth
My final graphic shows how Canada and its major provinces compare to the other G20 nations. I also include a few other nations, like Norway and North Korea as illustrative bookends. Click to view full size.
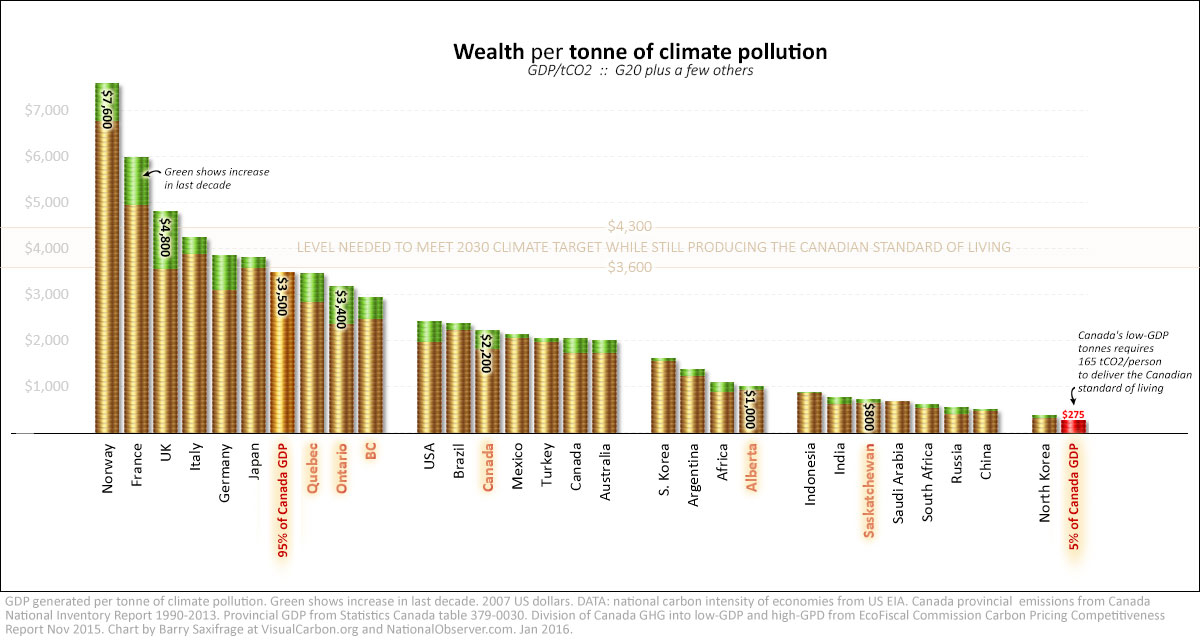
GDP PER TONNE — The coin stacks show how many dollars of GDP are produced per tonne of climate pollution. The green coins on top show the improvement over the last decade. For example, the UK economy currently produces $4,800 in GDP/tCO2. The UK's green coins show that they improved their emissions efficiency by 35 per cent in the last decade. Canada averages less than half as much at $2,200 per tonne. Canada’s emissions efficiency improved 23 per cent; Alberta’s 11 per cent.
STANDARD OF LIVING — As mentioned above, Canadians need to average around $4,000 in GDP per tonne if we are going to meet our 2030 climate target while also maintaining our standard of living. The chart has a band between $3,600 and $4,300 marking this goal. The $3,600 line means the economy would produce the current GDP-per-capita of around $45k in 2030. However, our GDP-per-capita has been growing around one per cent a year recently. If that rate continues it will reach around $53k in 2030. This would require around $4,300 per tonne. So a broad range is marked out.
ALREADY THERE — As you can see, Japan and several European nations are already at, or above, the $4,000 in GDP per tonne that we will need in 2030. Norway, a northern oil producing nation not unlike one our own provinces, produces over $7,000 per tonne.
CANADA'S HIGH-GDP TONNES — Quebec, Ontario and BC are within striking distance. More interesting to me, is that 95 per cent of our nation's GDP is too. The emissions from producing almost all our GDP average $3,500. Once again, this shows that most of our economy is poised for climate success.
CANADA's LOW-GDP TONNES — At the far right side of the graphic are the rest of our nation's emissions. These come from producing the remaining 5 per cent of our GDP (red coins). These 290 hundred million tonnes of climate pollution average around $275 each. As discussed above, efforts to try to shoe horn this quantity of low-GDP emissions into our ever shrinking carbon budget just isn't feasible. There are just way too many megatonnes worth to continue handing out free passes.
The carbon math is as simple as it is uncomfortable. Canadian climate success now requires significant reductions in all our major climate pollution sources. That's not going to be easy to do. Perhaps a new economic test for emissions -- one that evaluates how much Canadian GDP is created with each tonne of climate pollution -- can help clarify and guide the hard choices ahead.
Jobs, jobs, jobs!
As I'll detail in my next article, the same low-productivity pattern holds true with jobs as well. Our least wealth producing emissions also provide the fewest jobs. A lot fewer.
If we want to meet our international climate commitments while maintaining our level of employment then we also must act aggressively to reduce the amount of climate pollution per job in Canada.
--------------------------------
ARTICLE SOURCES & NOTES
Below is a snapshot of my base spreadsheet. It is basic math -- small amount of data -- high quality sources.
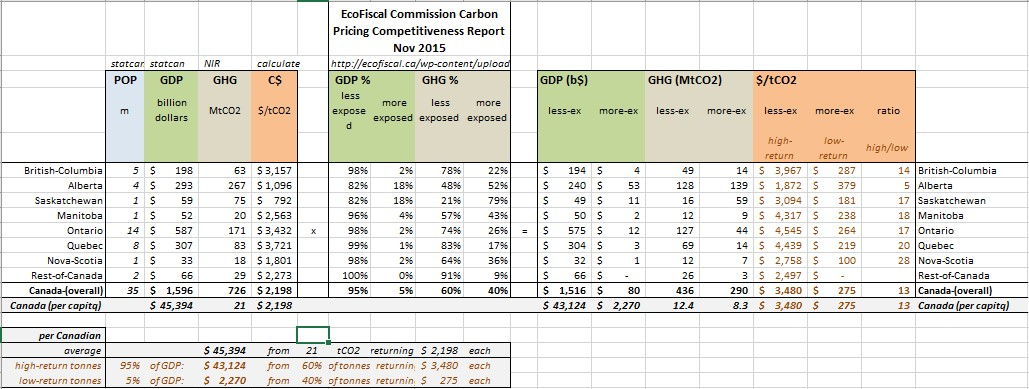
National and Provincial averages in the left panel:
- Population from Statistics Canada Table 051-0001
- GDP from Statistics Canada Table 379-0030 (chained 2007 dollars)
- GHG from Canada’s National Inventory Report.
- “$/tCO2” (orange topped column) calculated by simply dividing GDP by GHG.
Ex: Canada: $1,596b/726MtCO2 = $2,198 GDP/tCO2. - Current tCO2 per capita calculated by dividing GHG by POP: 726MtCO2/35.15m = 20.7 tCO2/person
2030 Targets:
- Population in 2030 projected to be around 41.5 million in StatCan middle growth case
- Canada’s 2030 climate target is 30% below 2005 levels which our NIR says is 749 MtCO2: 749 * 70% = 524 MtCO2
- Canada’s per-capita 2030 climate target: 524 MtCO2 / 41.5m = 12.6 tCO2 per capita
High-GDP and Low-GDP breakdown
- EcoFiscal Commission Carbon Pricing Competitiveness Report (Nov 2015) has a table showing percentages of GDP and GHG that are “more exposed” or “less exposed”. Their table is reproduced in the middle panel of my spreadsheet above. I multiply the GDP by the matching percentages listed for “less exposed” and “more exposed”. I then do the same with GHG values. To get the final orange topped columns of “$GDP/tCO2” I divide GDP by GHG.
International $GDP/tCO2
- US Energy Information Agency provides the carbon-intensity values for other nations. They, like most, list carbon-intensity in terms of tonnes per $GDP. I prefer (and so convert to) the inverse – $GDP per tonne. This is far easier for me to understand, remember and compare.


Comments