Thank you for helping us meet our fundraising goal!
The British Columbia government has recently made two big decisions that are pulling the province in opposite directions in the climate fight — approving LNG Canada and rolling out the new CleanBC climate plan.
The LNG Canada project is massive. It will sprawl from new fracked gas wells in northern B.C., across the coast mountains via the hotly-contested, 650 km "Coastal GasLink" pipeline, to a new liquefaction terminal in Kitimat. From there, the gas will be loaded onto supertankers and shipped to Asia. The LNG terminal is designed to be built in two phases, each of which will produce 13 million tonnes of liquid natural gas. The first phase is now going ahead.
If both phases get built it will become the "biggest capital project in B.C. history." And probably the most climate polluting as well, with projections for up to 10 million tonnes of climate pollution (MtCO2) per year. For scale, that's more than the emissions from all passenger cars, trucks and SUVs in the province today.
Despite the increase in emissions, the B.C. government says that LNG Canada will be compatible with the province's legislated climate targets. And now the government has unveiled their CleanBC climate plan that charts the path for meeting those targets.
So, does the plan find a way to build LNG Canada and still meet B.C.'s climate goals?
To help you decide, I've dug into the data and built the "missing chart" from the CleanBC plan.
Part 1: The current situation
Let's start with B.C.'s climate targets.
These are shown as grey bull's-eyes on my chart below. First up is B.C.'s 2030 climate target that calls for emissions to fall 40 per cent below 2007 levels. Then then in 2040, the target drops to a 60 per cent cut below 2007 levels.
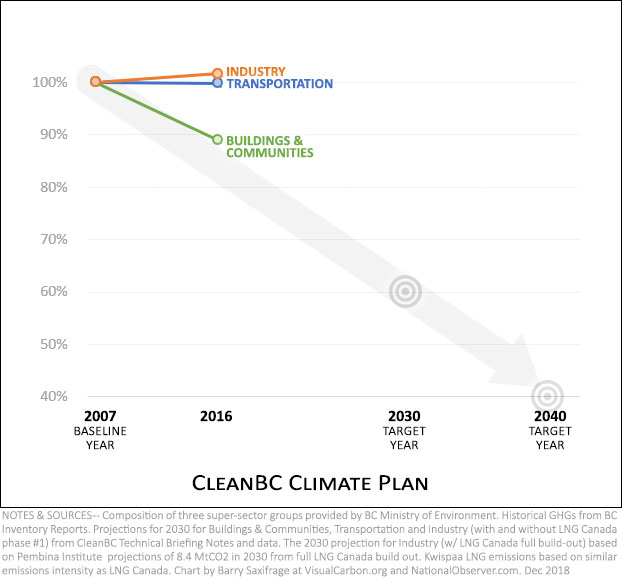
Also shown are B.C.'s emissions since their 2007 baseline year.
The CleanBC plan divides all of B.C.'s emissions into three big groupings:
- Industry
- Transportation
- Buildings & Communities.
I've shown each of these groups in a different colour.
As you can see, Industry emissions have been rising slightly; Transportation has held steady; while the Buildings & Communities sector has reduced emissions roughly along the path needed.
Part 2: The CleanBC good news
Next, let's look at the government’s projections under their new climate plan.
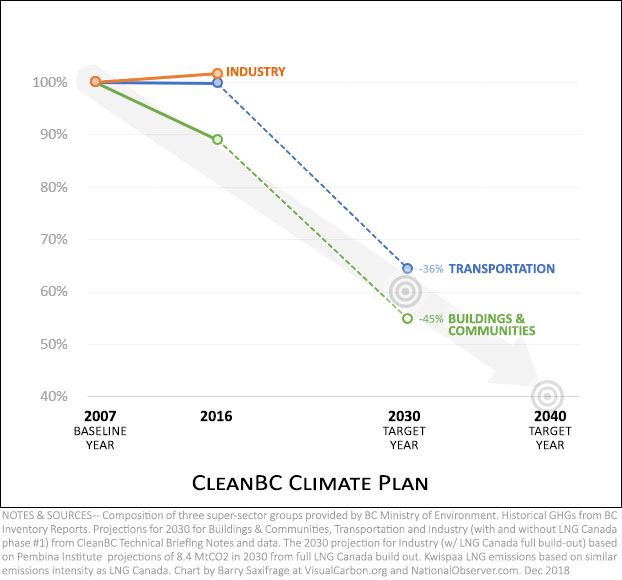
First, the good news: CleanBC is expected to get two sectors close to the province's 2030 climate goal.
The best performer is the Buildings & Communities sector shown by the dashed green line. With CleanBC policies, this sector is projected to cut its climate pollution even faster. It's expected to end up a bit below (i.e.: better than) the province's 2030 target.
The biggest change in direction is in Transportation, shown by the blue dashed line. Under CleanBC policies, this sector's emissions are projected to start falling. By 2030 the government expects them to end up close to the provincial target.
Part 3: Industry emissions & LNG Canada
Now the not-so-good news.
Climate pollution from Industry is projected to stay stubbornly high. And the primary cause is — you guessed it — pollution from LNG Canada. To illustrate the projected impact of LNG Canada I've added three scenarios to my chart.
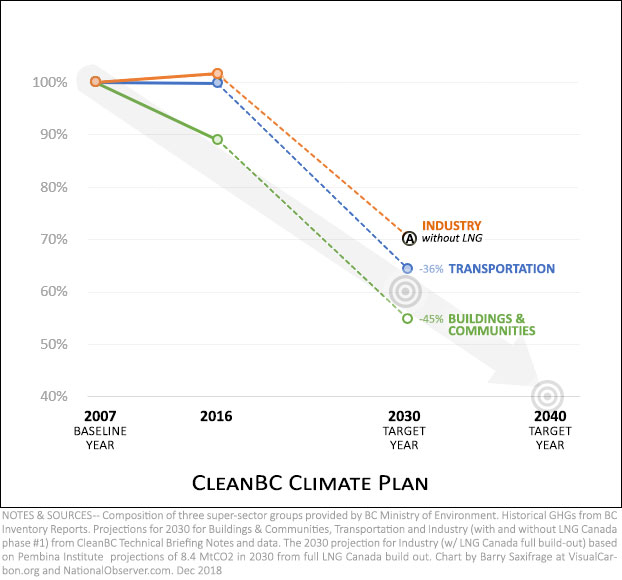
Scenario A — Without LNG
This first scenario is shown on the right, marked by point "A." That's where Industry would end up under CleanBC policies — if there was no LNG Canada.
While it is not all the way down to the target, it's in the neighbourhood.
This first scenario provides a "without LNG" baseline you can use to evaluate the impact of adding a new LNG industry.
Scenario B — LNG Canada Phase One
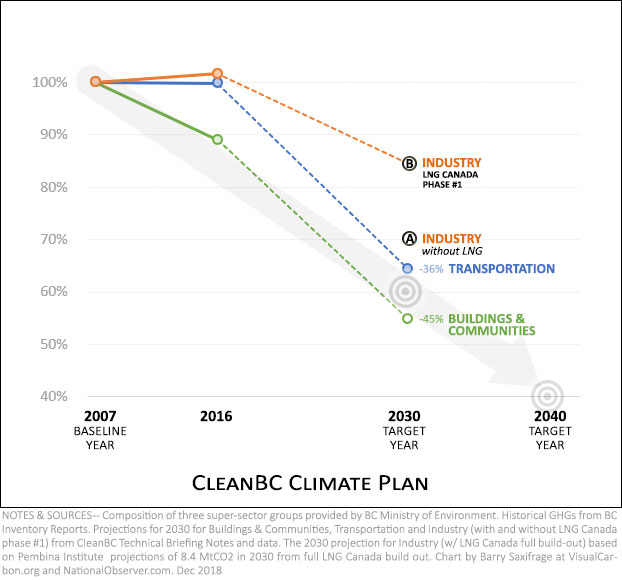
This second scenario shows what happens with only phase one of LNG Canada, which is underway now. It is marked by point "B."
This is the scenario used in the CleanBC plan. It includes an "aggressive upstream electrification" effort to reduce emissions from all the new fracked gas wells that will be drilled to feed the LNG Canada terminal.
In this scenario, Industry emissions end up falling less than half way to the provincial target in 2030. This would leave B.C. with a remaining emissions gap of around six million tonnes of CO2 (6 MtCO2). For scale, that gap would be roughly equal to the emissions from all passenger cars, trucks and SUVs in 2030.
Scenario C — LNG Canada Phase One & Two
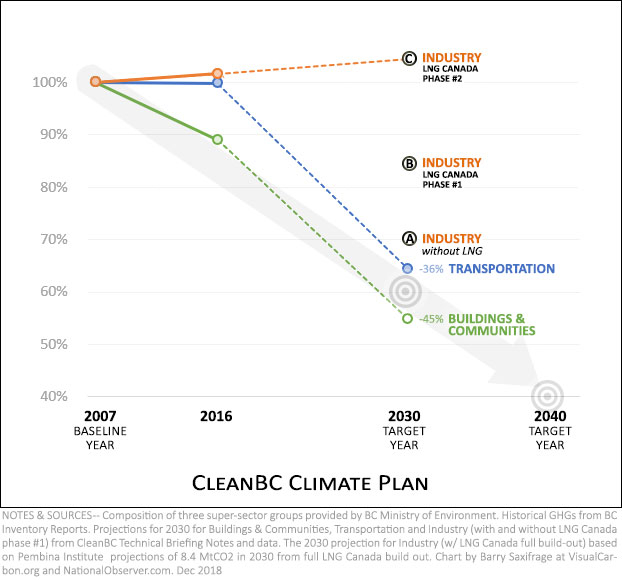
The third scenario includes emissions from a full build-out of LNG Canada — both phases one and two. Its marked by point "C."
As you can see, if both phases get built, then B.C.'s Industry emissions could end up even higher in 2030 than they are today.
If so, B.C.'s emissions gap could grow to 11 MtCO2 — more than all the remaining emissions in the Buildings & Communities sector at that point.
Note: For this scenario I relied on emission projections from the Pembina Institute. That's because the B.C. government doesn't provide projections for such a full build-out of LNG Canada. (I asked.)
Putting it all together — the 'missing chart'
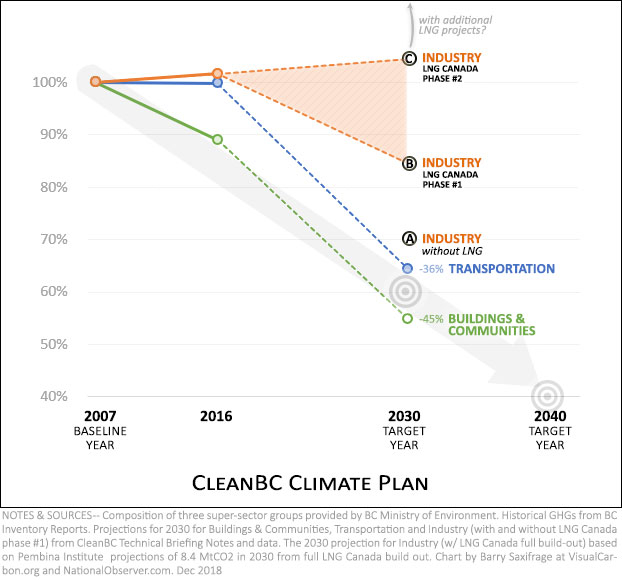
Here's a final version of my chart with all three Industry scenarios added.
You'll notice that I also tossed in a grey LNG arrow heading off the top of the chart. That's a reminder that at least two more LNG projects are currently pushing for approval:
If these also get approved, B.C.'s Industry sector emissions could jump by another fifty per cent.
Assuming LNG Canada is the only project approved, the chart's orange zone shows the potential range for Industry depending on whether phase two gets built.
Will phase two get built?
At this point, you may be wondering how likely it is that phase two will be built? And who, exactly, will decide?
The B.C. government has already given LNG Canada the permits to build both phases. And this fall they also gave them a generous financial incentive package — including a repeal of the LNG income tax, exemptions from the PST tax, lower BC Hydro bills and partial exemptions from the B.C. carbon tax — to sweeten the pot.
On the question of who decides, it seems that Shell Oil and its LNG Canada partners (PetroChina, KOGAS and Mitsubishi) will decide based on market conditions.
On the question of how likely it is to be built, the .B.C government is giving mixed signals.
When it comes to calculating the project's benefits, the government uses numbers that assume phase two will be built — $40 billion in spending and $22 billion in revenue. But when it comes to calculating the climate pollution, and what to do about it, the government uses numbers that assume phase two will not be built.
For its part, Shell Canada's President told Reuters: “What’s in our favor now is expansions are typically lower capital cost.” That gives phase two of LNG Canada a significant cost advantage over rivals. The decision is likely a couple years away. Perhaps in 2023?
Who will shoulder the burden?
Either way, LNG Canada is creating a multi-million tonne emissions gap that the new CleanBC plan doesn't have answers for at this point.
Andrew Weaver, leader of the B.C. Green Party, criticized approval of the project, saying "adding such a massive new source of (greenhouse gases) means that the rest of our economy will have to make even more sacrifices to meet our climate targets."
The big unanswered question is who in British Columbia will be assigned the burden of making extra cuts to offset LNG Canada's pollution. The CleanBC plan kicks that can down the road.
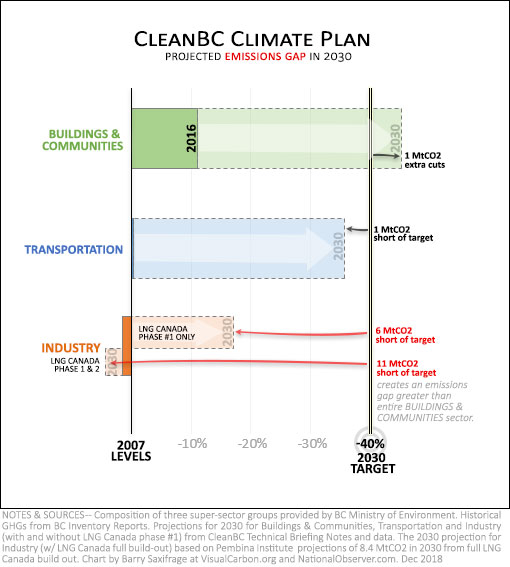
Here's another view of the situation to further illustrate the problem.
As in the previous charts, solid colours show emissions changes since 2007. And dashed lines show projected cuts between now and 2030.
Looking at the green and blue bars lets you see that both the Transportation and the Buildings & Communities sectors are already tasked with making huge reductions between now and 2030. Each sector is looking at roughly a one-third cut in the next decade.
And both sectors are projected to end up close to the overall target. In fact, together, they land right on it. There is no emissions gap here.
In contrast, the orange Industry bar shows the much smaller reductions projected for this sector — as measured both from 2007, and from today. This is where B.C.'s emissions gap is coming from. And, again, most of this gap is from LNG Canada.
It is this large emissions gap created by LNG Canada that CleanBC doesn't address. The question of who is going to be given the extra burden of cutting emissions to close this gap, is left unanswered.
As the chart shows, both the Transportation and Buildings & Communities sectors are already tasked with doing their share via big cuts. Will they also have to shoulder an extra burden to make even deeper cuts? Or will some collection of non-LNG companies in the Industrial sector be required to do it?
To provide a hint of how challenging this could be, consider that a full build out of LNG Canada could create an emissions gap (10+ MtCO2) that exceeds the expected emissions from the entire Buildings & Communities sector in 2030 (9 MtCO2).
For its part, the B.C. government says they will unveil more new policies in 2019 that will close the gap. British Columbians will get a better idea at that point who gets to shoulder the extra burden.


Comments
WOW !
"When it comes to calculating the project's benefits, the government uses numbers that assume phase two will be built — $40 billion in spending and $22 billion in revenue. But when it comes to calculating the climate pollution, and what to do about it, the government uses numbers that assume phase two will not be built."
Barry,
Would it be OK for me to embed any of your charts on the site I manage (along with credits)?
www.climateactonnow.ca?
It sounds like Treudeau's plan for trans mountain and how IT will move clean energy forward.