Support strong Canadian climate journalism for 2025
"My name is Greta Thunberg. I am sixteen years old. I come from Sweden. And I speak on behalf of future generations." – speech to U.K. House of Parliament, London, April 23, 2019
Swedish climate striker Greta Thunberg has travelled a long, slow, low-carbon way to bring her message of climate urgency to British Columbia.
In the spirit of cultural exchange, I decided to learn what I could about Sweden's own climate emissions and efforts. So if you, too, are interested in how our two northern jurisdictions compare on climate pollution, you're in luck. I waded through a fat pile of reports and spreadsheets to put together five comparison charts and the stories behind them.
Pollution Down. Pollution Up.
Let's start with annual emissions. My first chart shows the big picture.
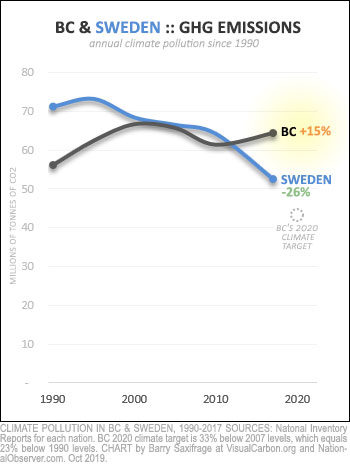
Back in 1990, Sweden dumped a lot more climate pollution than B.C. did. Fifteen million tonnes (15 MtCO2) more.
But, since then, the Swedes have slashed their emissions by a quarter.
B.C. has pumped it up.
As a result, we've traded places. B.C. now emits a lot more climate pollution than Sweden.
I've also included B.C.'s 2020 climate target on the chart as a dotted circle. (It sits at 23 per cent below our 1990 emissions level.)
Sweden has already cut even deeper than that, reducing emissions 26 per cent below their 1990 level.
It is clearly possible for wealthy northerners to achieve the pollution we promised. Heck, the U.K. has managed to pull off a 41 per cent reduction since 1990.
Greta: "A lot of people say that Sweden is a small country, that it doesn’t matter what we do. But I think that if a few girls can get headlines all over the world just by not going to school for a few weeks, imagine what we could do together if we wanted to. Every single person counts. Just like every single emission counts. Every single kilo. Everything counts. So please, treat the climate crisis like the acute crisis it is and give us a future. Our lives are in your hands." – speech to Stockholm Climate March, Sept. 8, 2018
Person by person
Greta: "The bigger your carbon footprint, the bigger your moral duty." – speech to the World Economic Forum, Davos, Jan. 25, 2019
Next, let's look at the amount of climate pollution emitted per person.
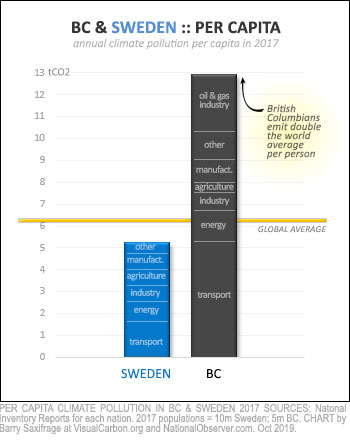
Sweden is home to more than twice as many people as British Columbia. And as my second chart shows, the average Swede emits a little over five tonnes of climate pollution (tCO2) each year.
That's one tonne less than the global average.
British Columbians, in contrast, emit more than double the global average.
Why are Swedes polluting so much less? To look for clues I dug deeper to find the emissions that each sector of the economy causes.
Two things jump out for me.
First, you can see that transportation is by far British Columbia's biggest source of climate pollution. So big, in fact, that our per capita transportation emissions exceed the Swedes footprint for everything. We'll take a look two of the biggest transportation problems — driving and flying — below.
The second thing that jumps out at me is the pollution from B.C.'s oil and gas industry, shown at the top of the bar. The industry alone emits 2.6 tCO2 per British Columbian. That's half Sweden's total.
And now the oil and gas industry is poised to double its climate pollution in B.C. if they build just two of their currently planned LNG projects: LNG Canada and Kitimat LNG.
Those two examples just scratch the surface of what we could learn from studying the emissions of Sweden and most other European nations. If you want to explore more, the official greenhouse gas (GHG) inventory for Sweden, and for most other major nations, are here. And like Greta's speeches, Sweden's report is, very helpfully, in English.
Each kilometre driven
As we saw above, transportation is one of the biggest pollution differentiators between our regions. So I decided to look into the biggest component of the sector: cars.
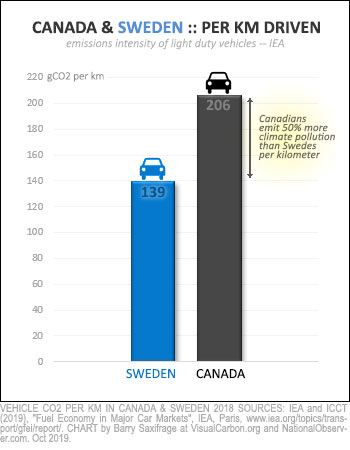
My third chart shows the amount of climate pollution emitted per kilometre for the average passenger vehicle. This data comes from a recent report by the International Energy Agency.
The blue bar shows that Swedish cars average 139 grams of CO2. This is similar to cars in the U.K. and many other European countries.
At this rate, a car travels 7,200 kilometres for each tonne of CO2 it emits.
I couldn't find data specific to B.C. cars, so I've used the Canadian average from that same IEA study. What it shows is that Canadians currently drive the world's dirtiest passenger vehicles.
On average, our cars emit 206 grams of CO2 per kilometre. That's 50 per cent more pollution for every kilometre than in Sweden. Our cars take us only 4,850 kilometres for each tonne of CO2 that gets dumped out the tailpipe.
What can British Columbians do who want to clean up this mess? Stop buying new vehicles that burn fossil fuels. The average new fossil-fuelled car in Canada will emit 66 tCO2 from burning gasoline. If you really need a new vehicle, buy an electric one that runs on B.C.'s nearly zero-carbon electricity. It's the only option that aligns with future climate targets.
'Flyskam'
There is one area in which Swedes pollute far more than the global average: burning jet fuel. As my next chart shows, Sweden's per capita CO2 from flying is roughly three times the global average.
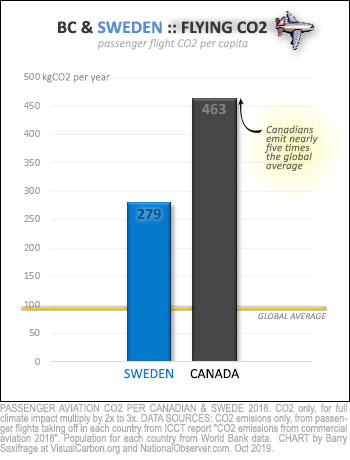
This level is so high that the Swedish have a word for how many of them are starting to feel about it: "flyskam."
This translates roughly to "ashamed of flying." There is a growing movement in Sweden, and elsewhere, of people who feel conscience-stricken and are cutting back or giving up fossil-fuelled flying completely.
The industry and many media stories I have read are incorrectly presenting this concept as an effort to "shame others for flying."
Greta may be the world's most famous airplane refusenik.
Before she started her public climate strikes, she started at home asking her family to lower their carbon footprint by giving up flying and eating meat. Over two years they did both, even though her mother, an opera singer, had to give up her international career as a result. Greta says her parents' agreement to work for a low-carbon life gave her hope that she could make a difference in the fight for a safe climate future.
Greta: “I’ve decided to stop flying because I want to practise as I preach, to create opinion and to lower my own emissions. One person who stops flying will not make a difference. But if a large number of people do, then it will. It sends a message that we are in a crisis and have to change our behaviour.” – interview with HuffPost
Sidenote: If you want to learn more about the climate impacts from different transportation options, here's an infographic and article I put together on the topic.
'Our new currency': GDP vs GHGs
My final climate chart covers a subject that I think is critical to our economic future but that gets little attention in Canada. It's the carbon-intensity of the economy. And it's usually measured in climate pollution per dollar of GDP.
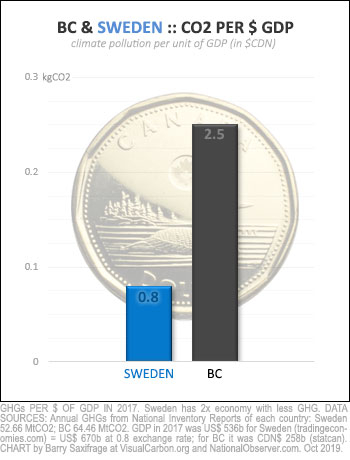
I couldn't find a direct comparison between Sweden and B.C. on this, so I did my own rough calculations.
In 2017, Sweden's GDP was around $670 billion in GDP (Canadian dollars). B.C.'s was less than half as much, at $260 billion.
Dividing those figures by each region's emissions results in the chart on the right.
As you can see, the Swedish economy is much cleaner than B.C.'s.
B.C. has to emit three times more climate pollution to produce each dollar of GDP.
As CO2 becomes more expensive to emit, economies that create the most value from each tonne will have an economic advantage.
Greta: "We should no longer measure our wealth and success in the graph that shows economic growth, but in the curve that shows the emissions of greenhouse gases. We should no longer only ask: ‘Have we got enough money to go through with this?’ but also: ‘Have we got enough of the carbon budget to spare to go through with this?’ That should and must become the centre of our new currency." – speech to U.K. House of Parliament, London, April 23, 2019


Comments
Great article, but one thing is missing: what is the reason for this dramatic difference? One of the major ones is Sweden's carbon tax. Their carbon tax was implemented in 1991 and has increased over the years to its current rate of EUR 114/ton (CAD 165/ton). Sweden's carbon tax started with a higher rate on households than industry, but now both pay the same rate, unlike BC's or Canada's. BC's Carbon tax is CAD 40/ton or about one quarter of the rate of Sweden's. Where BC's carbon tax has reduced the province's emissions per capita slightly, Sweden's much more established and high carbon tax has had an effect that is much greater.
https://www.government.se/carbontax
https://www2.gov.bc.ca/gov/content/environment/climate-change/planning-…