Support strong Canadian climate journalism for 2025
You’ve been hearing there's a global climate summit happening in Madrid this week. If you’re wondering what these international negotiations are and whether they have been making any progress, you’ve come to the right place.
Every year, the countries of the world get together and try to figure out what to do about the accelerating climate emergency. In United Nations jargon, it’s called a “Conference of the Parties,” which is why you’ll hear it described as “COP.”
COP25
This is the twenty-fifth year of these meetings, so the Madrid meeting is called COP25. Governments have been meeting about climate change ever since the Earth Summit in Rio de Janeiro in 1992. Back in Rio, the countries negotiated a climate treaty — called the UN Framework Convention on Climate Change. It came into force two years later. And ever since, the 197 countries that are parties to the treaty have been meeting once a year.
Every year they meet and every year the climate emergency has gotten worse.
In 2015, they created the Paris Agreement aiming to keep "global temperature rise this century well below 2 degrees Celsius ... and to pursue efforts to limit the temperature increase even further to 1.5 degrees Celsius."
Sounds promising, but the actions required are voluntary and the agreement is toothless. Each country sets a target for how much pollution it will allow and agrees to update those targets every five years. If every country followed through on the targets they've set themselves so far, temperatures would rise as much as 4 degrees. And almost none of them are on track to meet their existing targets.
As you know, climate change is mostly caused by burning fossil fuels — oil, gas and coal. Fossil fuels create climate pollution when they’re burned, and the biggest problem is carbon dioxide (CO2). Increasing the amount of carbon dioxide and other greenhouse gases in the atmosphere creates a thickening blanket around the earth that allows heat from the sun to get in, but less and less of it to get out. It’s like rolling up your car windows on a hot day.
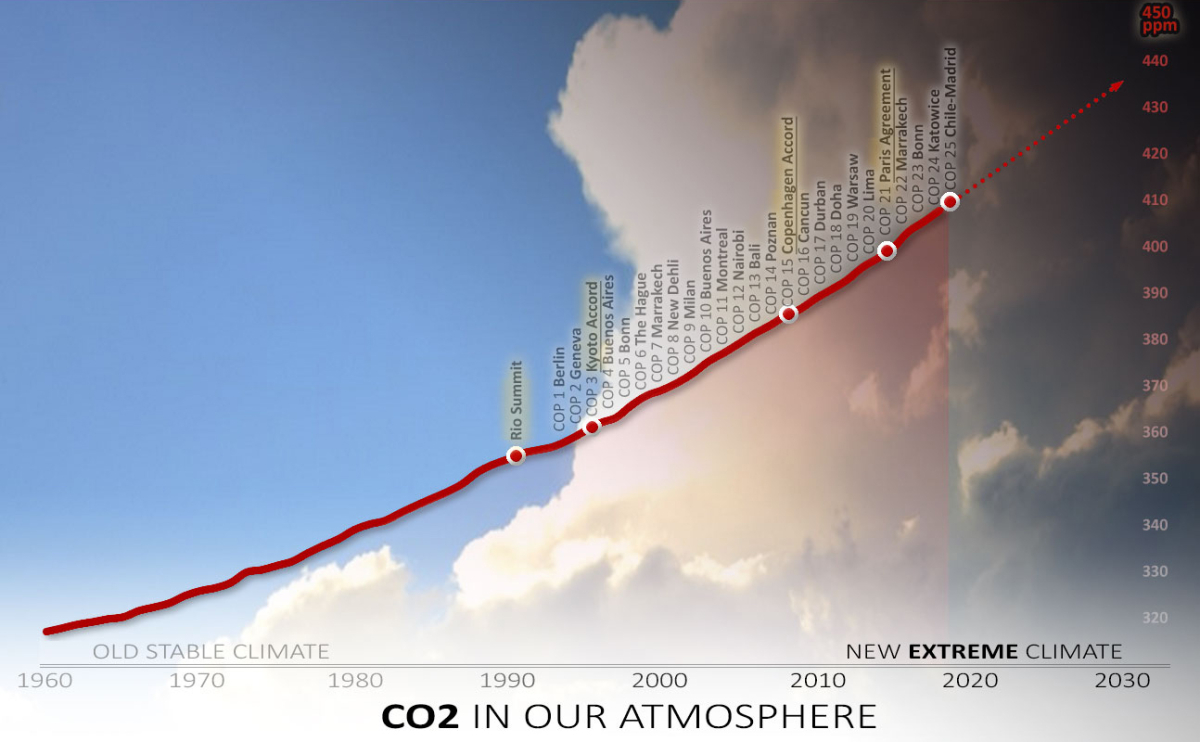
Since governments are meeting again right now, it seems like a good time to dive into the history of the COPs compared to the amount of CO2 dumped into the atmosphere.
COPs vs CO2
"Whatever our world leaders are 'doing' to reduce emissions, they are doing it wrong" — Greta Thunberg
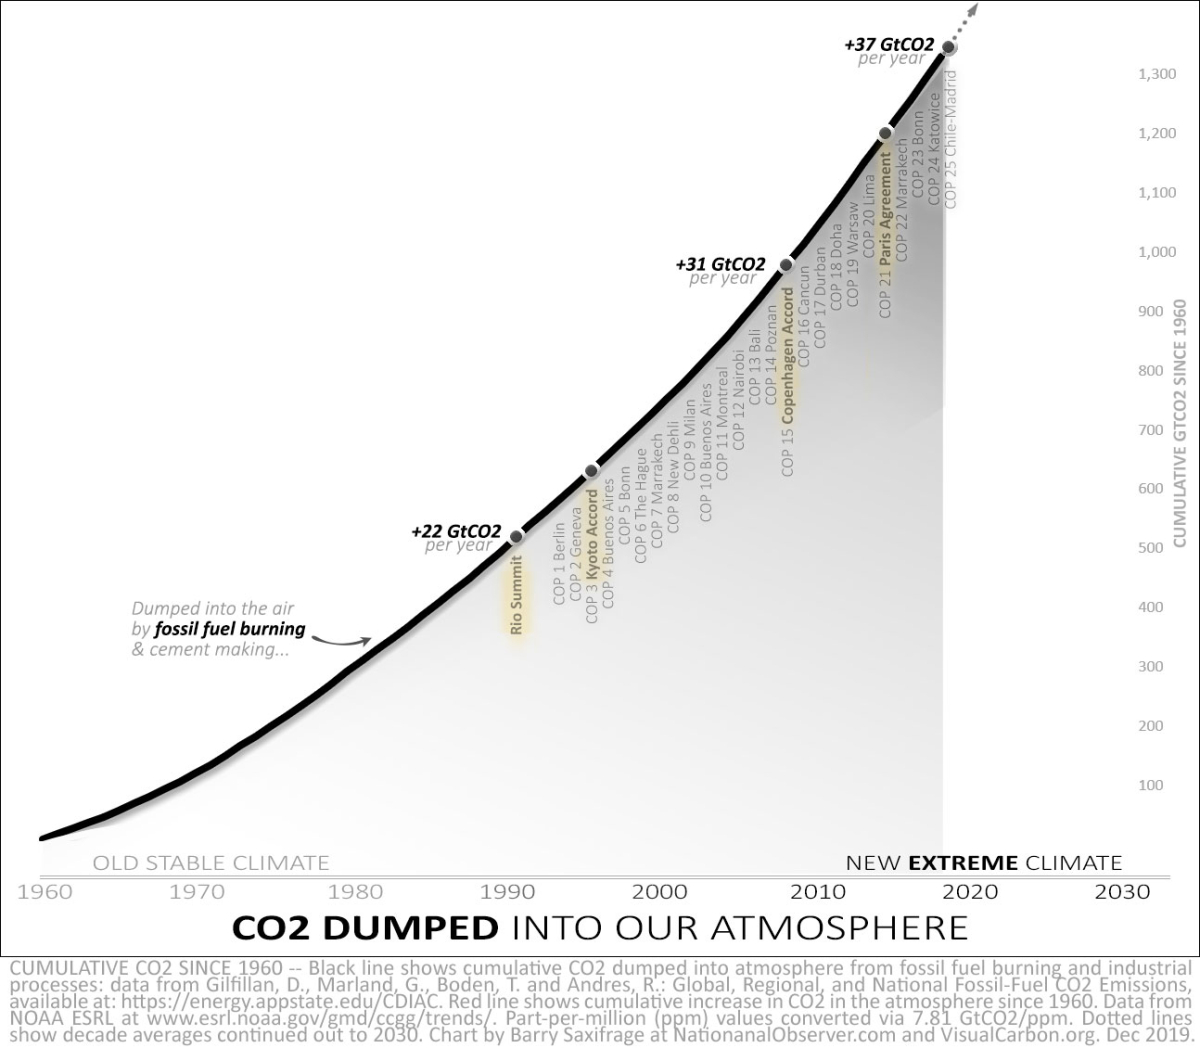
As you can see from this first chart, world leaders keep meeting about climate change, but they’re also allowing more and more burning of fossil fuels. Not only is climate pollution increasing, it’s actually accelerating.
Despite years of governments setting targets, promising to build clean energy, vowing to phase out fossil fuels and get more energy efficient, climate pollution just keeps going up.
Climate in chaos. Oceans 30% more acidic
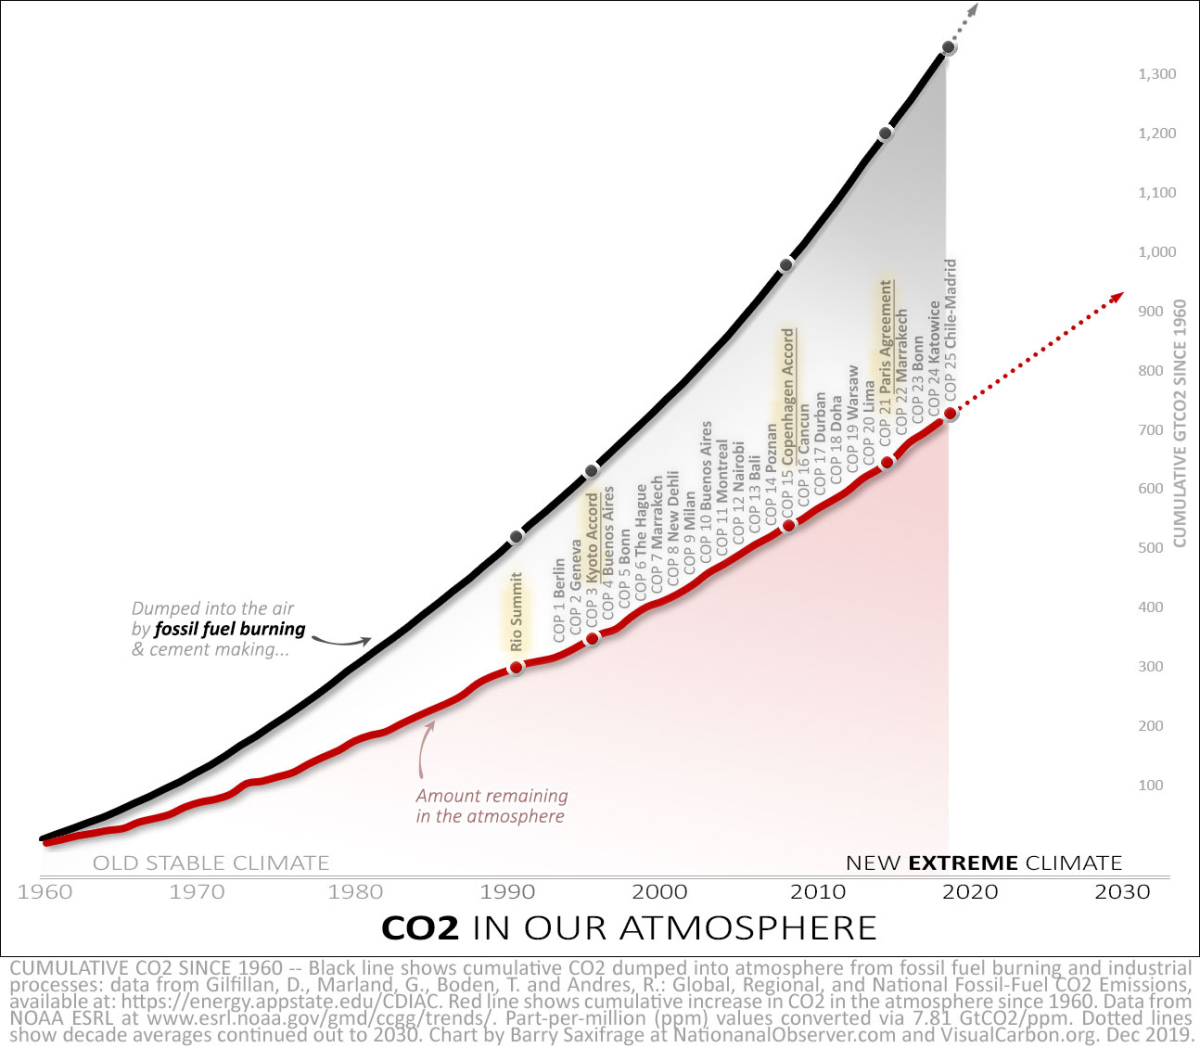
On this second chart, we’ve added a red line which shows how much of that fossil fuel CO2 is accumulating in our atmosphere. This shows how quickly the heat-trapping CO2 blanket is thickening around our planet.
What you’ll notice right away is that there’s a big difference between the two lines. That's how hard mother nature is working to save us from ourselves.
Roughly a third of our climate pollution gets soaked up by bacteria, algae and plants on land.
Another quarter of it dissolves into water, driving ocean acidification. We are current dumping into the oceans around one tonne of CO2, per human, every year — nine billion tonnes a year, in total. So far, the hundreds of billions of tonnes of our fossil fuel CO2 that has dissolved into the ocean has already increased sea water acidity by 30 percent. This is causing widespread harm to species ranging from corals to oysters. It will take nature thousands of years to remove the CO2 we are dumping into it in just a few decades.
As you’d expect, based on the increase in climate pollution, the pace of ocean acidification is accelerating as well.
Accelerating in the wrong direction
On this third chart, we’ve added dotted lines that show the trendlines for climate pollution in each decade. Not only is pollution increasing while governments hop from one global climate summit to the next, it's increasing at an accelerating rate.
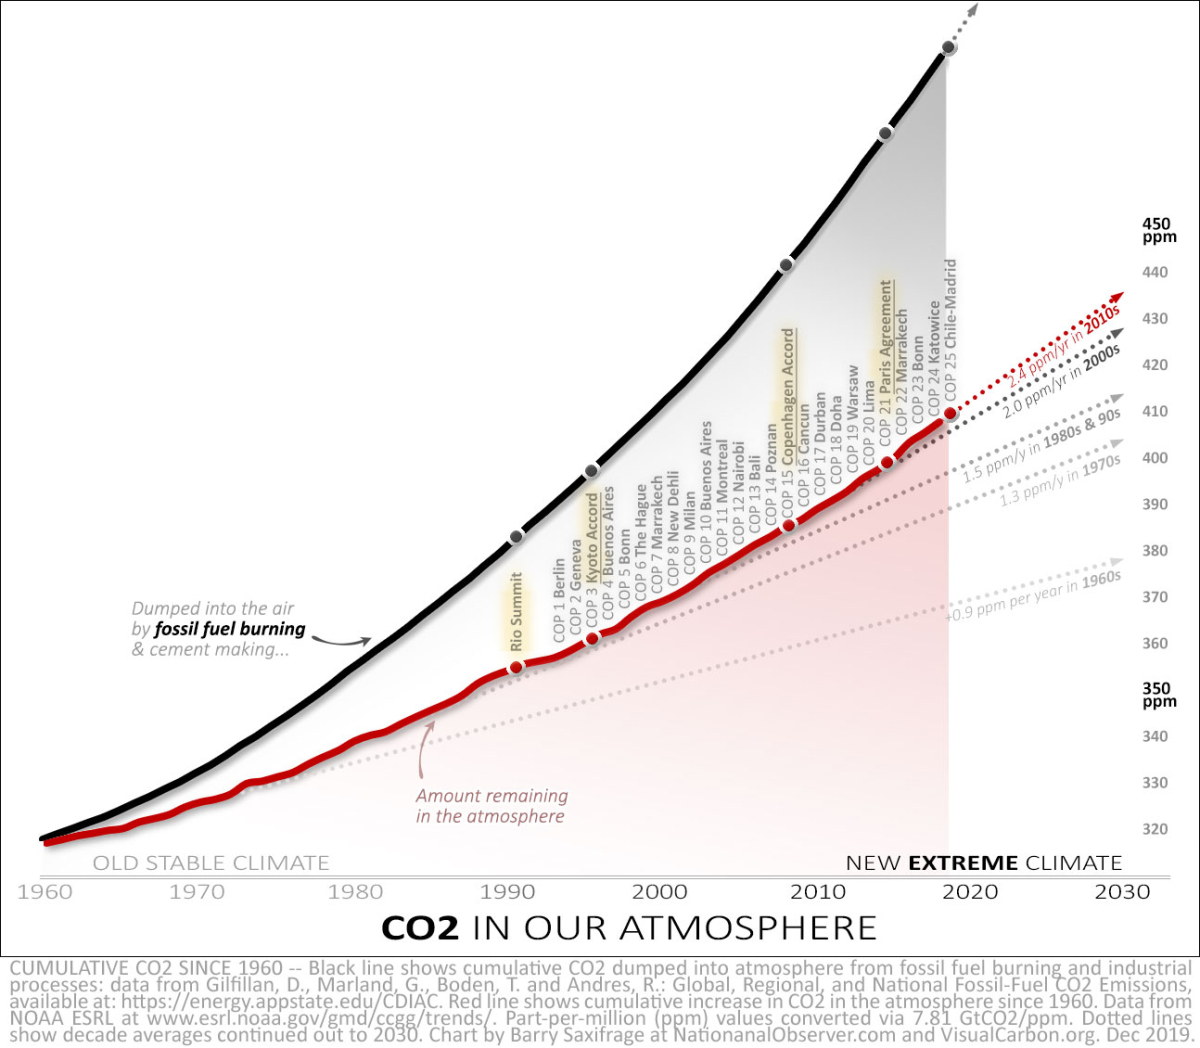
There have been big changes in global politics since the Rio Earth Summit. China has grown to be the biggest climate polluter in the world as the country grew its economy and reduced poverty. The economic rise of “developing nations” is part of the story behind the rise in pollution. But, it’s not the whole story. Canada, for example, is now the ninth biggest polluter in the world. And we’ve grown to be the world’s fifth largest producer of oil and gas. The U.S. is the second biggest polluter in the world. Some industrialized countries, like the U.K, have been making serious cuts in their climate pollution. But most rich countries are still way off track.
Climate “change”: an understatement 2 miles thick
The current increase in CO2 is much, much higher than the changes that drove our planet from the last ice age to its present climate. It’s sobering to remember that just a few degrees Celsius made the difference between Canada today and a Canada buried beneath a massive ice cap. The ice was two miles thick over the Montreal region, and a mile thick over Vancouver. So much water was locked up in ice that global sea levels were 125 meters lower.
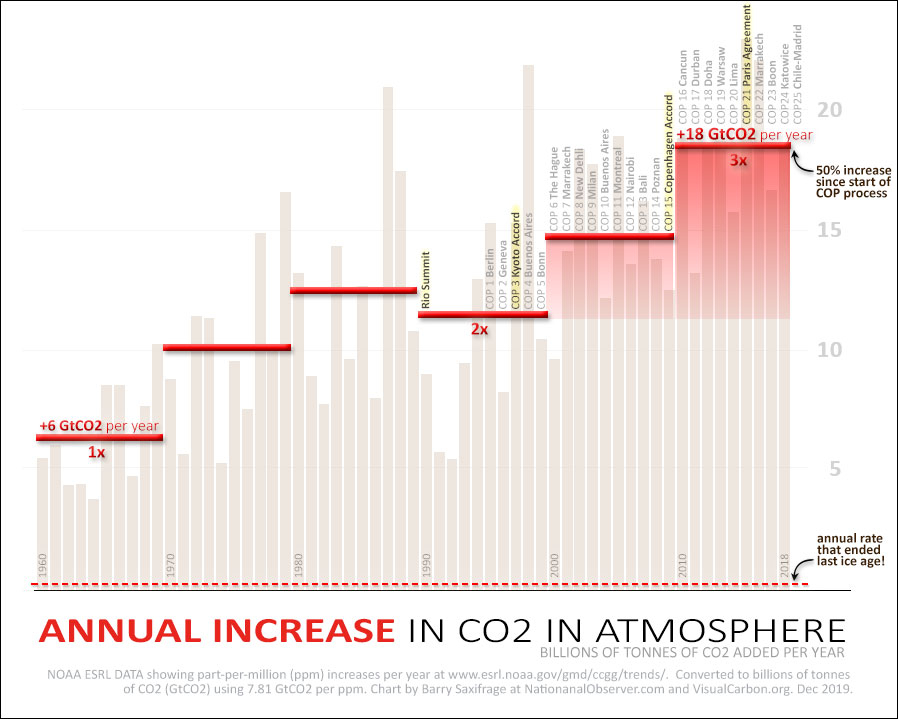
In this final chart, we’re showing the annual change in CO2 instead of the cumulative change shown in red on the charts above. We’ve included the ice age melt line for context because scientists say that "... a giant 'burp' of carbon dioxide (CO2) … helped trigger the end of last ice age, around 17,000 years ago."
If that was a "giant" burp, what would you call the trends we're seeing now? All those climate negotiators in Madrid should stop and consider that, “... the rate of CO2 growth over the last decade is 100 to 200 times faster than what the Earth experienced during the transition from the last Ice Age… A real shock to the atmosphere.”
So, perhaps it shouldn’t shock us that the World Meteorological Organization just warned that the planet's temperature is rising more quickly than most scientists had realized. The world’s average temperature may go up as much as five degrees Celsius by the end of the century.
That’s almost triple the outer limit of safety defined by the world’s scientists and enshrined in the Paris Agreement. And, as we noted earlier, no industrialized country is on track with the Paris agreement.
A few degrees might not sound like much. But let’s remember those massive, mile-thick ice sheets. NASA describes it this way: "As the Earth moved out of ice ages over the past million years, the global temperature rose a total of 4 to 7 degrees Celsius over about 5,000 years. In the past century alone, the temperature has climbed ... roughly ten times faster than the average rate of ice-age-recovery warming."
No wonder our kids are rallying in the streets.




Comments