Canada's vast managed forest lands used to be critical allies in our climate fight and efforts to build a sustainable, carbon neutral forestry economy. That's because these forests used to be healthy enough to absorb the huge amounts of CO2 created by the logging industry's harvests — plus lots more.
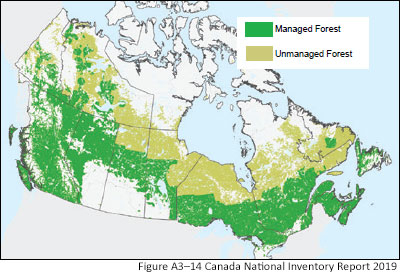
This huge forest carbon sink benefited us in many ways in addition to climate safety.
The logging industry benefited because it allowed them to promote their wood products as both sustainable and carbon neutral. But now they find themselves cutting more than is growing back — putting both their economic advantages and social licence at risk.
Other carbon-intensive industries, like oil and gas and aviation, have been counting on a large and enduring forest carbon sink to supply carbon offsets to meet climate targets. Without millions of tonnes of these hoped-for Canadian forest carbon offsets, these industries face faster, deeper and more expensive cuts to their own climate pollution.
Unfortunately for all of us, our forests' deep and valuable carbon sink has nearly dried up. Decades of human abuses — from climate disruption to clearcutting — have left them too battered and weakened to even keep up with business-as-usual logging. Put simply: Our continent-spanning managed forests are now being cut down faster than they are growing back.
The result has been a rising flood of CO2 pouring out of our managed forests and accumulating in our atmosphere — worsening both the climate and ocean acidification crises.
My first chart shows how extreme this has become over the last decade.
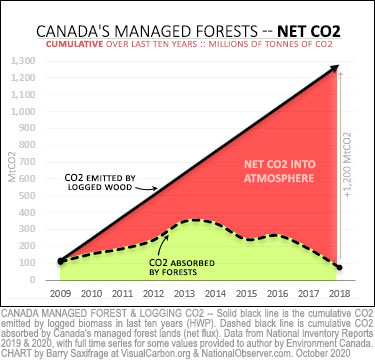
The rising black line shows the cumulative CO2 emitted by the logging industry's harvested wood over the last 10 years. These logging emissions added up to more than 1,200 million tonnes of CO2 (MtCO2).
Now compare those emissions to what our managed forests were absorbing over those same years. That's the faltering lower dashed line. The forests absorbed less than 100 MtCO2 — not even one-tenth of what the logging industry emitted.
The remaining 90 per cent of those logging emissions, shown by the red area, have been accumulating in our atmosphere, intensifying climate disruption. The decision to keep cutting more than is growing back has resulted in more than a billion tonnes of excess CO2 emissions — so far. And, as we will see in detail below, the long-term trend lines show the problem growing increasingly worse.
That's the grim story told by the data in Canada's official National Inventory Reports (NIRs). I've dug into that data to create a series of charts that illustrate what's going on.
What they show is that this flood of climate pollution has now grown too large and out of control to keep ignoring. Ottawa needs to start acting on this threat while we still have a shot to rein it in.
What’s the plan, Ottawa?
The climate science is clear that avoiding a full-blown climate crisis requires us to reduce all our emissions to zero in the next few decades.
Canada's current efforts to do this includes a price on climate pollution — a carbon tax levied on most sources of emissions in the other sectors. It's small fee, but it's a start.
As the federal Canadian government says: “A price on carbon pollution is an essential part of Canada’s plan to fight climate change and grow the economy. Pricing carbon pollution is the most efficient way to reduce greenhouse gas emissions and stimulate investments in clean innovation. A price on carbon pollution creates incentives for individuals, households, and businesses to choose cleaner options.”
However, Ottawa continues to exempt one of our largest sources of climate pollution — the roughly 155 MtCO2 per year emitted by the logging industry's harvests. (For a detailed breakdown of these emissions, see the article endnotes.)
 To put the scale of these logging emissions into context, my next chart compares them to all other sectors in Canada. I've also included a grey dashed line showing the oilsands industry portion of the oil and gas sector.
Roughly three-quarters of emissions in the rest of our economy are covered by our national carbon pollution pricing. However, all 155 MtCO2 in logging emissions are excluded from the carbon tax.
In addition, Ottawa also exempts logging emissions from our other emission-reduction policies and targets. For example, under Canada's 2030 Paris Agreement pledge, the target for all other sectors is a 30 per cent emissions cut. But Ottawa created a separate target just for these logging emissions that allows them to rise, not fall.
These special exemptions for logging emissions are based on the notion that our managed forests are reabsorbing as much CO2 as logging creates. This, they argue, makes the logged wood “carbon neutral.”
Sadly, this isn't happening anymore. As we've seen above, and will see in even more detail below, the government's own data shows that the logging industry has been cutting and emitting more than our managed forests are able to absorb.
As U.S. President Donald Trump learned with COVID-19, ignoring a clear and growing threat won't make it “disappear … like a miracle.”
Likewise, efforts in Canada to push this clear and growing threat off our books with creative accounting simply allows the crisis to spiral out of control. What we need instead are new policies from Ottawa to address this threat.
The climate-safest new policy option would be to require logging emissions to not exceed what our managed forests absorb. That would stop the CO2 flood and return the forests to net zero. Doing this would require a lot of government support for the impacted forestry workers and forestry economy. But it could also have significant long-term economic benefits compared to the current path of not acting.
For example, it would make it easier to convince clean tech investors and the global marketplace that Canadian forest products are — and will remain — carbon neutral. If you think selling thermal coal is getting hard to do, imagine trying to sell wood that isn't considered carbon neutral for burning. Burning wood is even more climate-polluting than coal per unit of energy. The long-term sustainability for our logging industry, and the social licence that goes with that, depends upon not cutting more than grows back. And rebuilding the forest carbon sink to be larger than what logging emits could also restore some of the valuable forest carbon offsets that other industries count on.
Alternatively, if Ottawa decides it wants to allow the logging industry to keep emitting more CO2 than our managed forests are absorbing, then it should at least apply our national carbon pricing to the industry's emissions. For the same good reasons it applies it to our other excess emissions sources.
I can see reasonable arguments for either limiting logging emissions to match the forest sink or for imposing a climate pollution fee on the excess logging CO2.
But there is no reasonable case for continuing to ignore the surging climate threat posed by our managed forestry emissions.
From carbon sink to super-emitter
To better understand the dramatic CO2 changes unfolding in Canada's managed forests and the growing threat they pose, let's dig a bit deeper into the data.
I'll start with the most critical number — the net CO2 balance of Canada's managed forests. This includes both the CO2 absorbed via tree growth and the CO2 emitted by trees that decay or are logged.
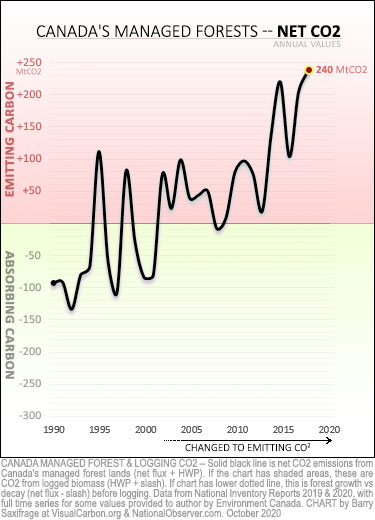
This net CO2 exchange with the atmosphere is what our climate system reacts to. On my chart, it's shown by the bold black line.
As you can see, back in the 1990s, the CO2 balance was mostly down in the green area. That means our forests were overall CO2 absorbers (carbon sinks). They grew back faster than they were logged and helped slow climate change.
But since then, the CO2 balance has moved increasingly upwards into the red zone. In these more recent years, our managed forests became CO2 emitters (carbon sources). That means the growth rate couldn't keep pace with logging. This has intensified climate change.
In 2018, for example, net emissions into the atmosphere totalled 240 MtCO2. That was more climate pollution than even our oil and gas or transportation sectors emitted that year. This is not a climate threat we can safely ignore.
Forest growth versus logging
My next chart breaks down the net CO2 balance into its two components. In its NIR, Canada reports forestry CO2 in two parts: forest growth and logging emissions.
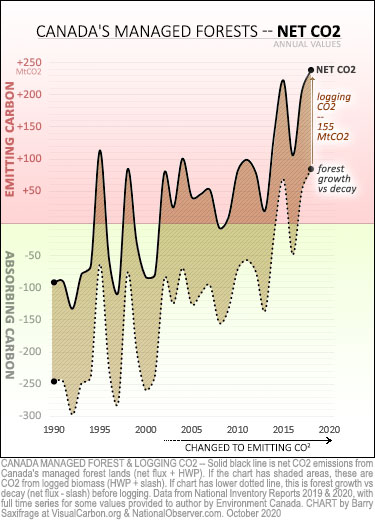
The first part, forest growth, is now shown on the chart as the lower dotted line. It's the balance of growth and decay.
The second part, logging emissions — at roughly 155 MtCO2 per year — is shown by the shaded area on top of it.
Specifically, this logging CO2 is what is emitted by logged trees and other forest biomass when it gets burned for energy or when it rots at the end of its use. It also includes emissions from slash left behind by logging.
As this more detailed chart makes clear, net forest growth has been weakening for decades.
This weakening is not part of a normal cycle. It is being driven by a combination of human actions. These include forestry practices that have weakened forest health and resilience, like clear cutting old-growth and replacing it with single-age, single-species monocultures. And they include human-fuelled climate changes that are turbocharging the four horsemen of forest decay: wildfires, insect kills, droughts, and storms. (For details see my forest carbon explainer.)
What this chart also shows is that logging emissions have stayed high even as forest regrowth has plunged. As a result, logging emissions have increasingly exceeded what Canada's managed forests absorbed. The excess CO2 — indicated by the shaded area up in the red zone — has been accumulating in our atmosphere, worsening the climate and ocean acidification crises.
Visualizing the long-term trend
The chart above shows a forestry system in trouble and hemorrhaging CO2. But the big annual swings in that chart can make it hard to see how robust the underlying trends are. Is this just a few freak years or is it a consistent shift? Is the trend improving or growing worse?
When climate scientists and policymakers are confronted with “noisy” data like this, they look at multi-year averages to understand long-term trends.
My next chart does just that. I've faded out the annual lines and overlaid them with their 10-year running averages. Each point on these trend lines is the average of the 10 years leading up to it.
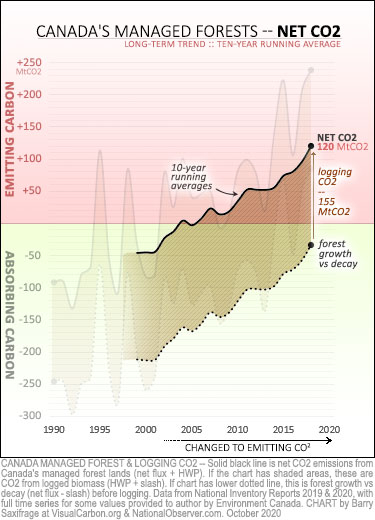
As you can see, the transition from valuable carbon sink into super-emitting threat has been a robust, steady, multi-decade trend that shows no signs of stopping under continued business-as-usual.
To reverse this threat, Ottawa will need new policies that start restoring the forest carbon sink, while also addressing the huge amounts of logging emissions that exceed it.
The one glimmer of hope that I see for returning our forests to much-needed carbon sinks is shown by the dotted bottom line. It shows that the long-term trend in forest growth — before logging — is still a small net sink. That means we might still be able to manage our forestry so it is both climate safe and sustainable.
As it is, however, the decade average for business-as-usual logging emissions has now risen 120 MtCO2 more each year than our managed forests are able to offset.
I'll wrap up by adding this long-term trend line to the sector emissions chart.
Excess logging emissions versus other sectors
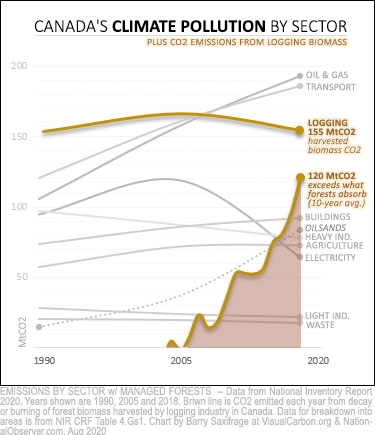
As before, the top brown line shows the total emissions from all the wood logged each year. That's currently running around 155 MtCO2 a year.
And the long-term trend for the amount that exceeded what the forests absorbed is shown by the lower brown line that's rocketing upwards. That's averaged at 120 MtCO2 per year over the last decade.
Either way you slice it, logging industry emissions dwarf nearly every other source of climate pollution in our country. In fact, they exceed what 150 countries emit for everything.
Does that look like “carbon neutral” logging to you?
Does it look like we are heading toward a safe climate future by continuing to ignore emissions at that scale?
Not to me. What it looks like to me is a runaway carbon train with the conductors still shovelling fuel into the firebox. The people in charge of our climate and forestry policies need to start acting on this threat before it derails both our hopes for both a safe climate future and for a long-term sustainable forestry economy.
EXTENDED ENDNOTES
Canada's forestry carbon accounting can be confusing for many. The media rarely has time to dig into the data deep enough to fully explain what's going on. And the government keeps shifting how and where it reports forest carbon data in the NIR. The government even keeps changing the targets for it. So, for those readers who would like a bit more detail on what was covered in this article, I've added some more in-depth endnotes.
Breaking down logging CO2 into its many sources
The vast majority of logging emissions come from the wood and other forest biomass it cuts. That's the roughly 155 MtCO2 per year that was discussed in this article. These are the emissions that Canada currently exempts from our carbon pricing and other climate reduction policies and targets.
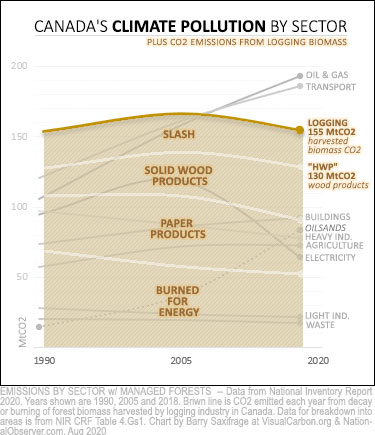
These emissions come from four major sources, as shown on my chart.
The biggest source is burning forest biomass for energy. It emits more than 50 MtCO2 per year. For comparison, that's roughly the same as all the coal burning in Canada. Canada rightly carbon taxes coal CO2 to fight the climate crisis. But it gives an equivalent amount of CO2 from burning wood a free pass. To make matters worse, burning wood actually releases more climate pollution per unit of energy produced than coal does.
The second-biggest source comes from discarded paper and paperboard products. These emit around 40 MtCO2 a year.
Nearly as much gets emitted by solid wood products that have likewise been discarded at the end of their useful life.
Together, these three sources make up the “Harvested Wood Products” (HWP) category. This is all the biomass physically removed from the forests by logging. Canada tracks and reports HWP emissions as a top-level item in the NIR each year. It has been reported at around 130 MtCO2 per year in recent years.
The final big source is known as “slash.” This is the emissions from all the biomass debris left behind by logging and from all the carbon-rich forest soils disturbed by logging operations. These together emit a guesstimated 20 to 25 MtCO2 per year.
Finally, the logging industry also emits another 8 MtCO2, more or less, from burning fossil fuels. These emissions are appropriately subject to Canada's carbon tax. They are accounted for under the relevant sectors, like Transportation.
Where to find the data for managed forest CO2 in the NIR
All the data used in this article was published in Canada's NIR. But recent changes in how Canada accounts for forestry emissions have made some of it hard to find. Here's where to find the data I used:
- Forest growth — This is the CO2 balance of growth versus decay for all managed forest lands before logging. In more recent NIRs, this data is listed in NIR Table 6-5 as “net flux.” In older NIRs, it was listed in the top-level inventory table as “Forest Lands.”
- CO2 from harvested wood — This is the CO2 emitted by the logged wood and other forest biomass that was removed from forests. It is listed in the NIR in the top-level inventory table as “HWP.” To find the breakdown into the various sources, see the data in Table 4.Gs1 in the companion CRF spreadsheets.
- CO2 from slash — This is the CO2 emitted by the decay or burning of logged biomass left behind in the forest, plus the emissions from the disturbed soils. Canada tracks these slash emissions and folds them into the bigger “Forest Lands” NIR value. However, it does not break out the slash number separately. The slash emissions estimate used in this article of 20 to 25 MtCO2 per year was made by the author based on an email from Environment Canada explaining how to roughly approximate these emissions from the data it does publish.
Looking for even more info?
If you want a broader overview and even more details on forest carbon in Canada, you can try my in-depth forest carbon explainer.


Comments
You used 'Donald Trump' and 'learned' in the same sentence.
I guess that is the crux of it.
I read somewhere, maybe it was on one of those aspirational posters that were popular in the early 90's, that in life a lesson is repeated until learned. Perhaps one possible corollary might be that the definition of insanity is repeating the same failing behaviour while expecting better results.
Is there a political leader out there learning COVID's hard lessons? And how these lessons also apply, in spades, to our handling of the climate crisis? Or does our rapacious culture and civilization need to fail before we can collectively try something new? We know exactly what is going wrong, and why, and in most cases how to solve it, and yet we devote our collective energies to doing exactly the opposite, nearly all of the time.
So we look at Trump's craziness, his behaviours and the degree to which he both he projects upon and blames others - an unawares self-satirizing celebrity handed the keys to the kingdom, holding up a mirror for the rest us to see all that we are doing wrong.
Your first chart has me confused: the cumulative emissions graph rises with passing years as one would expect, but the cumulative absorption graph falls. How does cumulative absorption drop?
Just a guess: what grows back is initially only a subset of what was there originally? Perhaps if you allow the forest 100 years or so to get back to a climax community you may get back to where you started? But it could take much longer than that - who knows to what degree high-grading also takes its toll on forest genetics.
I assume it's because the absorption has gone negative - decay or fire in the forests would be counted as negative absorption...?
Thanks for your comment, Brian. Yes, a falling cumulative line can be confusing. The reason it is falling in the most recent years is because the forest growth (before logging) has switched to emitting CO2. Instead of a CO2 sink that is accumulating more CO2, the forests turned into a CO2 source that is spending down the stored CO2 capital. Just like a bank account where you put money into it for many years but then start taking out of it in later years. The cumulative balance in the account starts to fall.
You can see the annual contributions/withdrawals into the forests carbon bank account in my chart in the section titled "Forest growth vs logging". If you look at the bottom dotted line that represents net forest growth (before logging) you can see how it has jumped into the red in a few recent years.
I think it is certainly a troubling sign when our forests start dying faster than they are growing, even before logging. That highlights the urgency to change our biz-as-usual in our forests and start rebuilding the forest carbon health while we still can.
Every tree is emitting oxygen and absorbing carbon dioxide, I believe. So long as one tree is growing (adding mass each year) it should be adding carbon dioxide to the store. If our forest growth isn't healthy the amount of accumulation will be less than with healthy forests, but accumulation must be rising. Only if we burn more than is grown in a year can cumulation turn negative. If we have reached that point we surely are doomed.
I'm wondering if my confusion has to do with definitions. You treat the co2 from cut trees as released to the atmosphere, but I assume only wood that is burned as a release of co2. Wood that enters construction, or fabrication, remains a sequester of co2. Of course dead wood no longer adds to either the accumulation of co2 storage or the release of o2, so healthy, growing forest is important.
Hi Brian. Forest carbon was confusing to me as well. There are two parts to your questions. First is about the net CO2 from forest growth vs decay (not counting logging). This can -- and has been recently -- negative if more trees are dying and rotting than are growing back. This is happening in recent years because of increased insect kills/damages, increased drought, increased wildfire and even increased storm blowdown. All have been significantly increased by climate warming. The second part of your question has to do with CO2 released by harvested wood products. Wood products of all kinds turn back into CO2 as they are either burned or as they rot after being discarded. That's the basic carbon cycle. Plants take in CO2 and use the C to make woody tissue. Then burning or rotting (being eaten by fungi and microbes) turns that C back to CO2. Canada reports the actual CO2 released each year from all previously harvested wood. Hope that helps.
OK, Barry. If forest health has reached the point that CO2 from breakdown exceeds that absorbed by photosynthesis then we really are in deep do-do, which I guess is one point of your article. Raises a couple of further questions for me: is this recent deterioration a global phenomenon? And, breakdown of wood mass to release CO2 must also use up a corresponding amount of oxygen - does that mean our next crisis will involve decline in atmospheric O2?
On your second point, eventually carbon from wood is released, but there is a big difference between the release from burning and the release that occurs when logs decay in the forest over decades, or from the eventual decay of construction timbers that may well last for centuries. Our climate crisis behaviour should be less concerned about the decades- or centuries-delayed consequences of using trees for construction, don't you think?
I believe parts of the article indicate that there's not as much forest left, and due to a lot of it being basically badly planted (seedlings of uniform age and single species planted over clearcuts) it's also not growing as robustly. I suspect also that a forest of little 30-foot-tall young trees don't constitute as much biomass as a forest of 300-foot-tall, three-times-as-wide old growth trees.
I guess there's also things like mountain pine beetle, killing stands of trees so they sit around decaying and emitting CO2 even without being logged.
Yes. According to the data in Canada's NIR, our managed forests (which are massive and roughly the size of western Europe) have seen huge CO2 increases from decay that are starting to catch up to the huge CO2 absorption from new growth. The primary forces of rising decay in our forests are: wildfires, insect and diseases of many kinds, drought and to a less extent storms. It isn't one thing. It is increasing death by a thousand cuts. These forces of decay are rising because of climate changes and because of past forestry practices that have left the forests less fit and resilient to stresses like these.
It is false to claim that this is renewable energy when what grows back on degraded soils takes 75 years and is composed of lower quality species. Why is our government promoting biomass when it is 4 times more polluting than coal. In Nova Scotia they use bulldozers and plow up roots and all and then burn green wood. Just about everything to do with wood heat seems to be bad news.
1.) Natural Resources Canada GHG Calculator confirms Nova Scotia forest
bioenergy schemes are worse than coal, NS Forest Notes 17-01-03:
http://nsforestnotes.ca/2017/01/03/natural-resources-canada-ghg-calcula…
2.) Most wood energy schemes are a 'disaster' for climate change, McGrath M,
BBC 17-02-23: http://www.bbc.com/news/science-environment-39053678
3.) Forest Biomass Energy is a False Solution:
https://www.biologicaldiversity.org/programs/climate_law_institute/pdfs…
I guess that one could also ask why we still put ethanol in gasoline given how many questions there are around how much fossil fuel is burned in order for farms to produce it, or to put stuff out to the curb in recycling bins, when there are questions around how much of plastic food packaging produced can actually be diverted - when does 'recyclable where facilities exist' actually become the producer's concern?
How do we collectively and politically take the long term view on anything?
And how do we prevent anything that seems green at the outset morphing into just another Little-Lisa's-Recycling-Plant ?
https://simpsons.fandom.com/wiki/Little_Lisa_Recycling_Plant
Yes. Wood is more climate polluting than coal per unit of energy. I have link in the article to the official IPCC spreadsheet as well, if readers want more confirmation on this. The argument used to say wood is less climate polluting than coal is based on the idea that the forests will re-absorb as much CO2 as the wood that gets logged out of them emits. But sadly the data shows this isn't true anymore for Canada's managed forests as a whole. A final comment is that I also agree that it is an additional climate problem with wood burning that it takes even a healthy forest cutblock many decades to recapture the CO2 that was logged from it. That eliminates a huge amount of the potential carbon sink that would otherwise be available to us in the 2050 to 2060 time-frame that is so critical to avoiding breaching 1.5C or 2.0C and thereby kick-starting possible feedback loops.
Indeed. If we had no threat of climate change aside from wood burning, and we had a steady state economy that burned wood at the same rate it regrew forests to burn, then that would be net zero emissions. Those assumptions don't hold.
Another exemplary research piece, Barry. Your graphics are brilliant.
Some regenerative agricultural practices can be adopted for forests.
__________
From: Sustainable Agriculture Research and Education, Cover Crops and Carbon Sequestration:
“Sequestering atmospheric carbon (CO2) in the soil helps to offset greenhouse gas emissions […]. The soil has significant potential to store carbon and to mitigate the effects of climate change. Farmers, scientists and policymakers across the globe are particularly interested in the potential contribution of agricultural practices, like cover crops, to the sequestration of carbon in the soil.
“Cover crops are an important soil carbon sequestration strategy. The roots and shoots of cover crops feed bacteria, fungi, earthworms and other soil organisms, which increases soil carbon levels over time. Some farmers think of this sequestration as “restoring” their soil carbon to the level that it was before cultivation or the initial plowing of the soil for agricultural production. […]
“Cover crops are tools to keep the soil in place, bolster soil health, improve water quality and reduce pollution from agricultural activities.
They include cereals, brassicas, legumes and other broadleaf species, and can be annual or perennial plants. Cover crops can be adapted to fit almost any production system.
Popular cover crops include cereal rye, crimson clover and oilseed radish. Familiar small grain crops, like winter wheat and barley, can also be adapted for use as cover crops.”
https://www.sare.org/publications/cover-crops/ecosystem-services/cover-…
__________
These policies and practices can be brought into forestry with appropriate measures and species. Fixing the damage done to the soils, especially on slopes, is a crucial first step that should be followed by a dramatic change in practice toward regenerative forestry and Community Forest Trusts run by local regional districts, First Nations and municipalities with conservation and regenerative practices spelled out as enforceable rules. It’s clear that provincial political oversight (irrespective of the party in power) over this vital public resource has been taken over by private industrial interests to the detriment of ecological systems and the economy.
Soil is the foundation of forests.
Seeding with native species like red alder in BC forest cutblocks was recommended by UBC Forestry Prof. Hamish Kimmins in the 80s. Alder is a prolific fast-growing pioneer tree species that thrives in disturbed locations, can reach five metres from seed in three years, and can fix nitrogen while holding existing forest soils together, then building them with organic leaf material. It is classified as a “weed” tree in most conventional forestry practices, which ignores soil disturbance and loss through erosion, and the value-added nature of alder as a selectively harvestable tree that retains the tree cover while longer-lived species are planted in the gaps.
There are many carbon and nutrient-fixing herbaceous species (native and non-native) that can be embedded in a sticky mulch and sprayed via pressurized hydro-mulching techniques onto vast areas and slopes as a reparation project. Bio-compostable erosion control matting embedded with plant seeds selected to absorb atmospheric carbon and embed nutrients can be applied to many the steepest slopes that have not eroded down to bare rock — slopes that should never have been logged in the first place.
The next shift is in practice. First and foremost, protecting the few remaining old growth forests and establishing hard lines around sensitive habitat and unique stands within park lands and designating them as permanently protected is essential. Even protected forests should be subject to controlled burning that mimics natural fire regeneration and reduces the excessive build up of dead, flammable wood that occurs too often in “managed” forests that emphasizes the suppression of fires over long periods until the final huge conflagration fostered by the build up of fuel ignites and places towns and lives at risk. Forest fires must be accounted for in a climate-induced change of ethics in forest management.
Banning mono-cropping on the remaining lands along with industrial clearcutting would be next on the forest planning overhaul agenda. A mixed-species forest with a vast, continuous canopy creates a superior carbon sink than do plantations, as Barry eloquently expressed. A healthy forest with a plethora of native species, and possibly some non-native trees, can be selectively harvested with the goal of retaining a mostly continuous canopy. Algonquin Park has an active forestry practice, but you wouldn’t know it because the forests are modestly and selectively thinned while maintaining a solid tree cover and a healthy forest over all.
The long-range outlook for forestry must also recognize that the species mix will change as the climate warms. The final mixed planting plan would attempt to gauge the species and varieties best able to adapt to warming over the decades, accounting for a site’s particular conditions, and then to estimate how the forest will change further as warming progresses. This is all part of the adaptation process, and it will be subject to trial and error.
Forest scientists may eventually recommend taking seeds and cuttings from some southern species and creating forest reserves in Canada to stay ahead of the “warming line.” California redwoods are one such species. The giant mountain redwood (Sequoiadendron giganteum) has been planted as an ornamental tree in public parks and boulevards in Vancouver. They are very tough trees with a high quality wood. But the California coastal redwood (Sequoiadendron sempervirens) is dying out in its native habitat. The northern US Pacific Coast states and some fog-shrouded locales in Coastal BC could become refuges for these very special trees, with the primary objective being international conservation.
Regarding the economic potential of regenerative forestry and Community Forest Trusts, if a provincial forestry industry employs 100,000 privately contracted people for 10 years in a rampant resource high-grading project (seen BC on Google Earth lately?), followed by a downturn as the resource is quickly depleted, the average tax revenue and economic multipliers are equal to just 10,000 people employed over 100 years under conservation and regenerative practices. In the former case, massive cutblocks scar the land and are unharvestable for decades while warming and fires affect the second growth mono-crops as they try to reach maturity, and that follows big, inhumane rounds of layoffs.
In the second case, hundreds are employed permanently with less falldown under continuous mixed species forest cover that shades the forest floor and promotes soil build up, which is the real foundation of healthy forests. The net economic benefits of the latter are permanent and reside with local communities and their employees, often as unionized municipal workers with better salaries and benefits than the private sector contractors put under the gun by the rip & ship forestry multinationals.
Moreover, value added products like engineered wood for buildings (with better construction waste management and longevity in materials) to meet the growing population with more sustainable construction methods and efficacious principles in urbanism will no doubt grow from a decrease in the annual allowable cut and a move away from raw log exports, therein making Canada's forests more highly valued with less exploitation based on cheap native wood.
Better management takes its clues from nature. That applies to forestry and cities and economics alike. Achieving a continuous forest cover in Canada, segueing to regenerative agriculture and away from fossil fuel extraction, building better cities, and electrifying the economy with zero emission power will be doing more than Canada's fair share. It would be a model for everyone.
__________
From: Restore Natural Forest to Store Carbon:
“While they can support local economies, plantations are poor at storing carbon in comparison to natural forests. The regular tree harvests and clearing the land to replant it means that the carbon stored on the land is periodically released back to atmosphere. By contrast, naturally regenerating lands sequester carbon for decades as they revert back to their carbon-rich intact state. To succeed in stemming global warming means restoration programs must allow all these degraded lands to return back into natural forests – and protect them.”
https://discovery.ucl.ac.uk/id/eprint/10078178/1/Lewis_Nature_Final_Ver…
"Banning mono-cropping on the remaining lands along with industrial clearcutting would be next on the forest planning overhaul agenda. A mixed-species forest with a vast, continuous canopy creates a superior carbon sink than do plantations, as Barry eloquently expressed. A healthy forest with a plethora of native species, and possibly some non-native trees, can be selectively harvested with the goal of retaining a mostly continuous canopy. Algonquin Park has an active forestry practice, but you wouldn’t know it because the forests are modestly and selectively thinned while maintaining a solid tree cover and a healthy forest over all."
Overall agreed, but the affects of high-grading in selective logging practices should also be considered. In our area, while we have a diverse forest - well over 20 tree species - oaks, maples, birches, pines, hemlocks, butternuts, beeches, linden, ash and spruce in the main, but it's difficult to call it entirely healthy. Over the years high-grading has removed all of the straightest and strongest trees, leaving the twisted and gnarly to seed the next generations. I didn't really fully appreciate this until I visited the Temagami / Obabika forest where some remnants of untouched old growth stands still remain. Since then I haven't looked at our 100+ year old pines and hemlocks in the same way. Saved from the saw only by the luck of their flaws, resembling those trees oft painted by the Group of Seven, but shaped in part by poor ancestry and not by the wind as those painted were in Killarney and Georgian Bay.
Good comment. This is all the more reason to up the quality of forestry planning to avoid removing more biomass than that which is accumulating in given areas. The balance must be in the negative in areas where selective harvesting is allowed, with the rate of growth net positive in the same area. In addition, the carbon cycle will require documentation for analysis. What Canadian forestry company or public ministry even measures GHGs, let alone forest soil health before and after logging? Who today -- other than researchers like Barry Saxifrage -- are paying any attention to climate change and forests?
I believe this is why Community Forest Trusts are so important. The life cycle practices that encompass rehabilitation of soils and degraded landscapes, silvicultural research and propagation, planting, harvesting and protecting designated sensitive areas will be borne by local authorities (towns, regional districts and First Nations) who are in turn directly employ staff to maintain a sustainable working forest along with being charged with the responsibility to protect conservation areas and parks. Local elections will give these authorities credence and legal legitimacy. That is so much better than distant bureaucrats and ministers overseeing the works while being influenced by industrial interests.
Further reading of Barry's in-depth explanation below about the calculation of the CO2 cycle in wood / forests, it's painfully obvious that the "decay" of wood could be somewhat lowered of society used less wood and paper products overall. Recycling is one thing, but less consumption and tabulating embedded CO2 in Canadian wood exports should be part of the calculation as well.
Natural Resources Canada calculated that only 40% of emissions from a barrel of diluted Alberta bitumen is emitted in Canada, while 60% is emitted upon combustion in the receiving jurisdiction. It will be similar with wood products, and especially egregious with wood pellets made here for fuel to be burned for energy and heat in other countries.
I assume your first graph is telling us that all of the logged wood is converted into CO2e shortly after harvest? This is, of course, incorrect. This assumes that all logged wood either rots or is burned. Most harvested wood becomes paper or lumber, both of which have a long life. Yes, eventually they will rot or burn, but the relationship is not immediate and in the medium term contributes to the carbon sink. Secondly your graph indicates that our forests consume progressively less CO2 because of managed harvesting. This is also incorrect. A Managed forest implies that trees are replaced soon after they are harvested. Young, rapidly growing trees consume CO2. The fact is, harvesting old trees and replanting increases CO2 consumption by the forest.
Aside from these significant errors, clearcutting is not the anathema which you indicate. It is sound practice in a managed forest. I suggest you check into it's scientific validity.
For a more balanced perspective, I suggest reviewing this article:
https://thenarwhal.ca/canadas-forests-havent-absorbed-more-carbon-than-….
I read that article. It is very good. Thanks for the link. The only quibble I have about it is a lack of focus on the 155 MtCO2 that gets emitted by the wood logged out of the forests each year. That's one of the biggest emissions sources in our economy. It has been ignored so far because decades ago our forests were healthy enough to handle that level of cutting. But the government's data says they aren't healthy enough for many years now. And so for the last decade or so, logging has been cutting more than is growing back. That's not sustainable. It isn't carbon neutral. And it isn't climate safe, in my view, to keep pretending that we aren't cutting more than has been growing back.
I appreciate all reader comments and suggestions. As far as CO2 emissions from harvested wood, I used the official data published by Canada in its National Inventory Reports. Environment Canada calls this "Harvested Wood Products" or HWP. They explicitly say that this is the actual amount of CO2 emitted in each year by the burning or decay of all wood harvested in past years. They say they calculate this amount using tables that have the "half life" decay rates for a range of wood products, from paper to fiberboard to dimensional lumber. These are published. For many paper products the half life is around 2 years. I'm not a forest carbon expert so I can't say if they have the right half life metrics for Canadian wood products but I certainly encourage anyone who thinks that they are wrong to let Environment Canada know.
I also want to clarify about what my graph shows. It doesn't assume that "forests consume progressively less CO2 because of managed harvesting". It shows the government data for net growth in Canada's managed forests. The government says the net growth ("net flux") includes the CO2 absorbed by the new trees planted to replace logging. It includes CO2 absorbed by all the new growth in all the trees in the managed forests lands across Canada. And it also includes the CO2 emitted by trees that decayed from things like wildfire, insects, fungal attack, diseases, droughts and storm damages. The decline in net CO2 uptake over the last couple decades has been driven by increases in these forces of decay. Again, I'm not a forest carbon scientist...I'm just reporting what the federal government says is happening. Hope that clarifies
Thank you for the article. I don't pretend to understand all the details but agree with your overall sense of alarm.
Canada can't succeed moving into a future still based on resource extraction. Our future lies in value adding services to make existing resources more useful.
Population pressure will mean less space and less desirable space for growing forest, yet healthy growth of trees is essential, so we will have to be much smarter in forest management, and growth. Quite apart from providing a carbon sink, tree growth is fundamental to providing the oxygen we breath.