Support strong Canadian climate journalism for 2025
We Canadians are failing to live up to our climate promises.
Does it matter?
Will humanity be able to win the fight for safe and stable climate even if Canadians don't do their share?
Canada's climate pollution has now increased for four years in a row.[i] And our current climate policies are too weak to reverse this trend. Our federal government says that without significant new climate policies our emissions will keep going up far into the future. Compare Canada's rising emissions to what the world's best climate science says is required to prevent dangerous climate changes.
The world needs to cut climate pollution by "90 per cent or more between 2040 and 2070" to "maintain warming below 2°C" — International Panel on Climate Change (IPCC) Fifth Assessment report.
As our nation debates what to do, a common discussion point is: How important are Canadian emissions in the global scheme of things?
Some voices argue that our rising emissions, our foot-dragging and our broken promises don't really matter because our climate pollution levels are too small to matter globally. Others argue the opposite; that our emissions are globally significant and therefore we have a responsibility to at least keep pace with the Americans and Europeans in the climate fight.
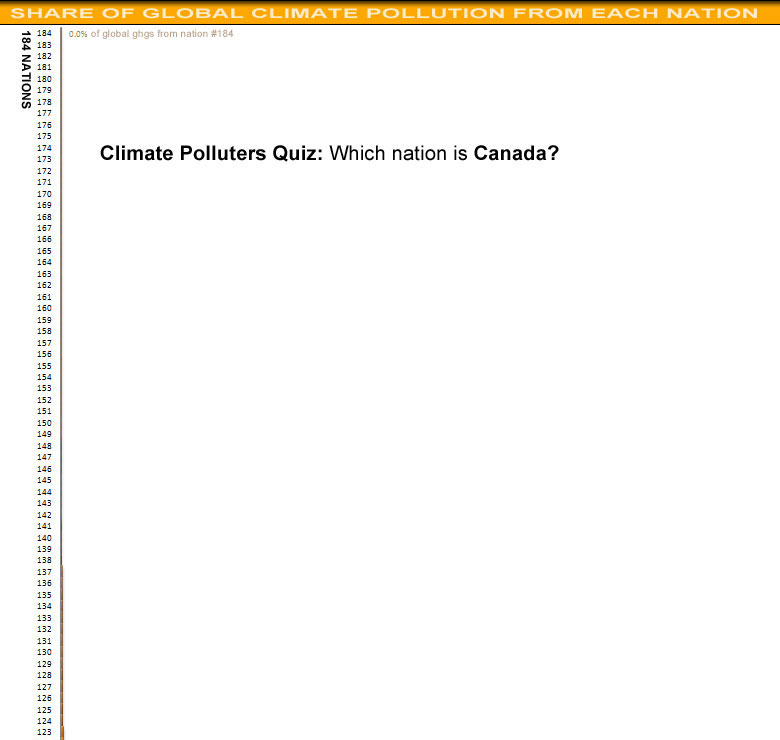
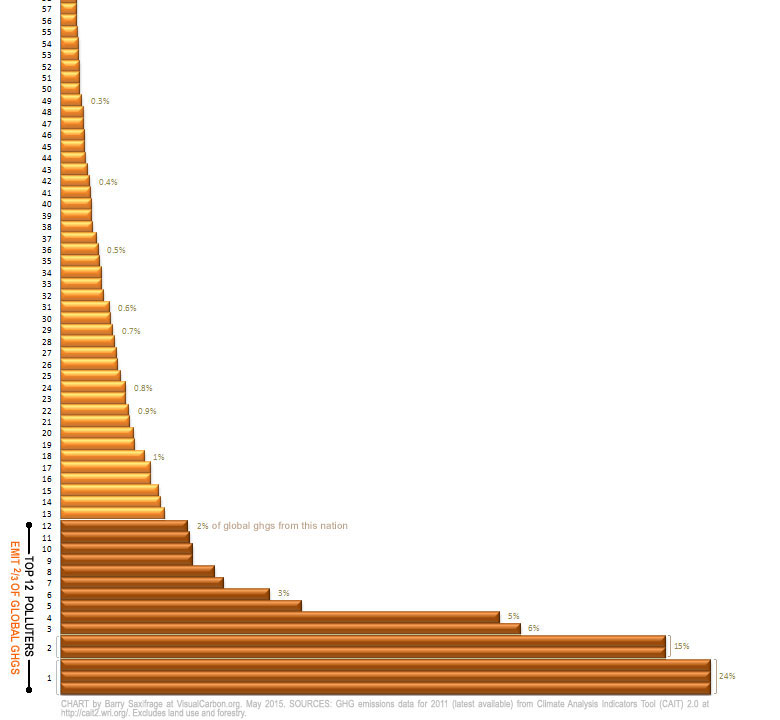
To help you decide, I created a chart showing the global context. Climate pollution from each of 184 member nations[ii] in the United Nations (UN) is arranged in order from least to most. As you scroll down the list, here are two questions to ponder:
- Which set of nations do you think are critical to winning the climate fight?
- Which nation is Canada?


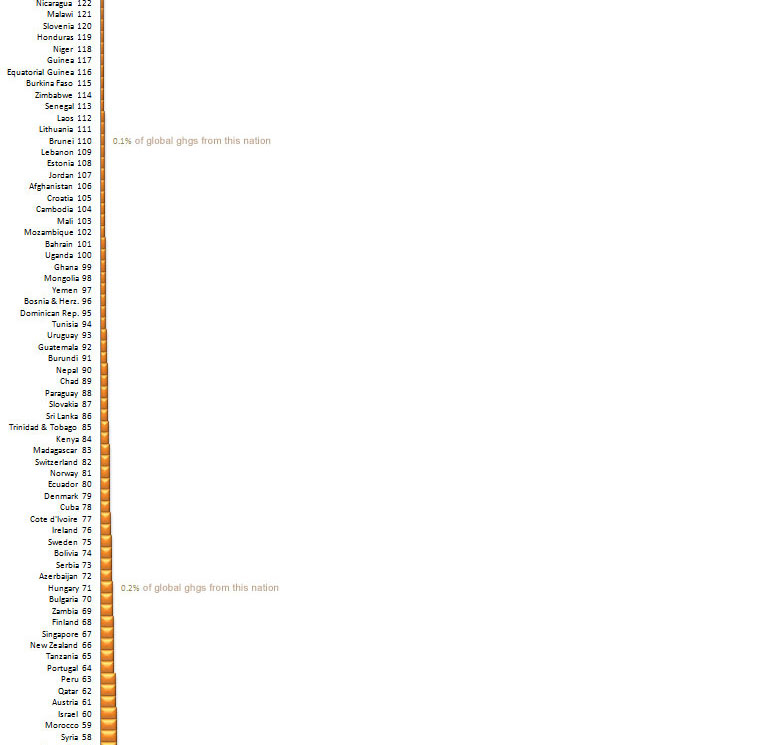
One thing this chart makes clear is that there are a lot of nations. In fact there are another nine nations (all tiny emitters) not included in the chart, for a total of 193 nations. [iii]
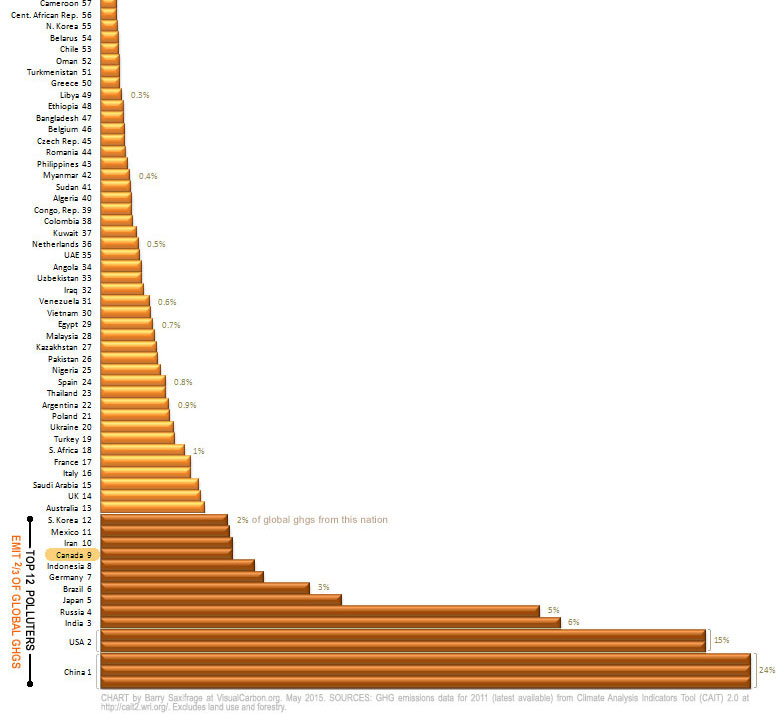
Secondly, only a small handful of nations account for most of the world's climate pollution. As the chart shows, the dozen biggest climate polluting nations alone account for two-thirds of the global climate crisis. All their leaders could sit down around a single dinner table.
And yes, Canada is one of those top dozen polluters, at #9.
So from a global perspective, there are 184 nations that emit less climate pollution than Canada. Amazingly, 80 of those nations combined emit less than Canada.
In addition, many of these less-responsible nations are much poorer than Canadians and are struggling to adapt to what the IPCC Fifth Assessment report called "unequivocal," "unprecedented" and "widespread impacts" that are already hitting us. This Pandora's Box of climate misery is going to grow ever more dangerous and damaging until we collectively shut the lid. To do that we must reduce climate pollution down to almost zero.
Here in Canada though we aren't shutting the lid — we are opening it even wider. Our climate pollution levels are going up, up, up. Will we change course and do something about it? Will we act in time? Does it matter if we don't?
In closing, here is the same chart, this time with the names of each nation added.


Notes and sources.
The emissions data comes from WRI, CAIT 2.0. 2014. Climate Analysis Indicators Tool: WRI’s Climate Data Explorer. Washington, DC: World Resources Institute. Available at: http://cait2.wri.org. It is for the year 2011, which is the latest available for all nations.
The two dozen most-climate polluting nations account for 80 per cent of global emissions. This small group will decide global success and failure. In contrast, the 140 least-climate polluting nations combined account for just 10 per cent of global emissions.
A similar chart of emissions per person would have Canada at #9 or #14 depending on whether land use emissions were included.
In the CAIT data, USA and Canada are the only two nations to appear in a top 12 list for both total emissions and emissions per person.
Footnotes
[i] Canada's latest official emissions report to the UN shows national emissions increasing by:
- + 8 million tonnes of CO2 (MtCO2) in 2010
- + 2 MtCO2 in 2011
- + 6 MtCO2 in 2012
- + 11 MtCO2 in 2013
[ii] The UN has 193 member nations. Only 184 are shown in the chart. The nine missing nations are all tiny emitters that were not represented in the CAIT database I used. Some are island nations and some are micro-nations in Europe like Andorra and Lichtenstein.
[iii] The CAIT database I used didn't have climate data for nine small nations including some island nations and some micro-nations in Europe like Andorra and Lichtenstein.


Comments