Support strong Canadian climate journalism for 2025
Since 1990, Americans have cleaned up their climate pollution — per person — twice as fast as Canadians. Americans have come from well behind in the climate race to catch up and current estimates show they have probably passed us already.
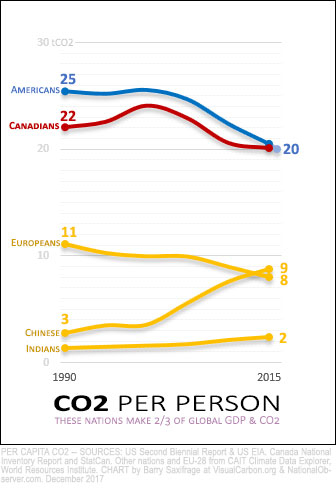
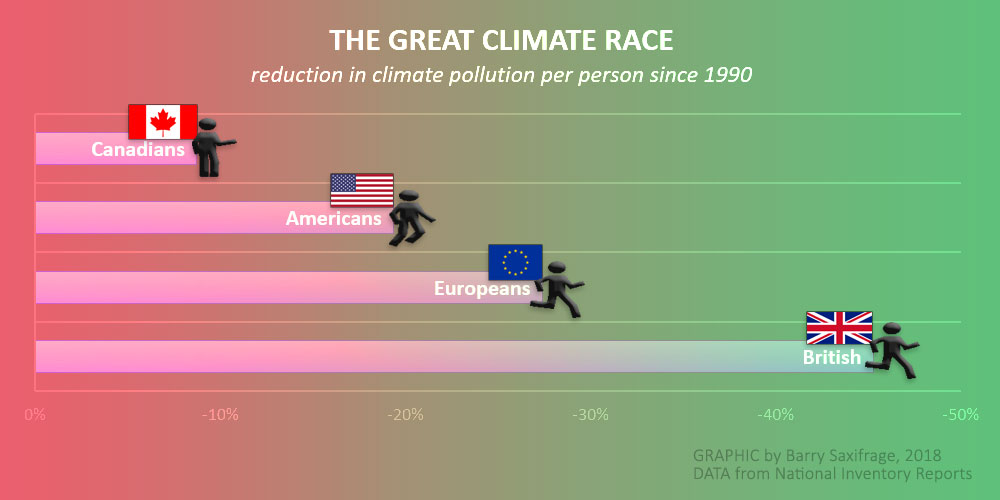
To illustrate how poorly Canadians have been doing in the climate race, I created the chart on the right. It shows climate pollution per person since 1990. The nations on this chart produce two-thirds of global GDP and climate pollution.
Americans catch up, and keep going
For decades, Canadians have been able to excuse our ongoing climate failure by pointing out that at least we aren't as dirty as the Americans.
But not anymore.
According to the most recent official inventory reports, the Americans pulled into a virtual tie with Canadians in 2015, at just over 20 tonnes of CO2 (tCO2) per person.
And according to recent estimates by the U.S. Energy Information Agency, America's emissions fell another 1.7 per cent in 2016. They project a further decline in 2017. If so, Americans are now below the twenty tonne mark per person.
Canadian foot-dragging, by the numbers
The reason the Yanks are beating us is that we have been dragging our feet for decades. Since 1990, Canadians have reduced our climate pollution by just 10 per cent per person while Americans cleaned up by 20 per cent; Europeans by 30 per cent; and the British by 40 per cent.
At this rate it will take 150 years before our climate pollution per person falls to the amount that Europeans emit now.
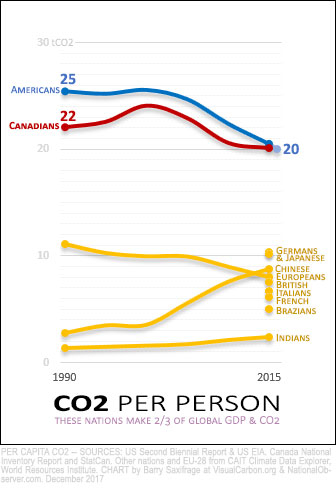
Not only are we moving slower than our peers, we're also a long way behind.
Canada has the world's tenth largest economy. I've added all the top ten economies plus the European Union to the chart. As you can see, these world-leading economies fall into two main groups.
In one group are the super polluters that emit 20 tCO2 per person each year. Americans and Canadians make up this group.
The other group contains all the other top economies. They pollute only half as much as Canadians do per person — or less.
The world average, by the way, is six tCO2 per person; roughly the level of French citizens. Canadians pollute at triple the world average.
Why are we doing so poorly?
To get some insight into why we are cleaning up so slowly, I turned to our official climate pollution inventory. The next chart shows how our per capita emissions break down by economic sector.
Two messages standout from this chart.
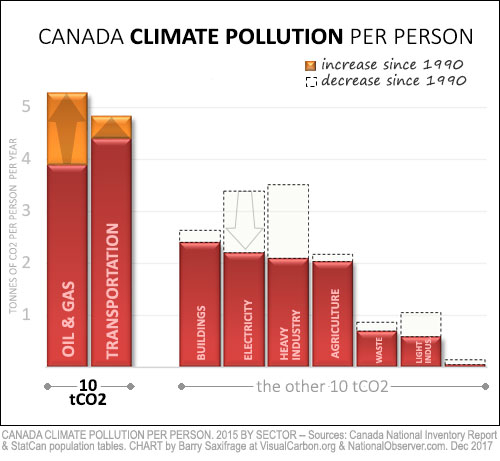
First, it shows that just two sectors create half of our nation's climate pollution:
- Oil & Gas Production
- Transportation
Combined, these two sectors now emit 10 tCO2 per Canadian — that's more than Europeans, Chinese or Indians emit for everything.
The second key message is that these two sectors have become even more climate polluting — per Canadian — since 1990. That's wiped out much of the gains made elsewhere.
In every other sector of our economy, Canadians have managed to cut our climate pollution per person.
We've been doing the climate shuffle — two steps forward, one step back. That foot-dragging has allowed the Americans to catch up, and likely pass us by.
Accelerating climate failure
The most recent emissions projections from the Trudeau government show the situation is rapidly getting worse.
My last chart tells the story.
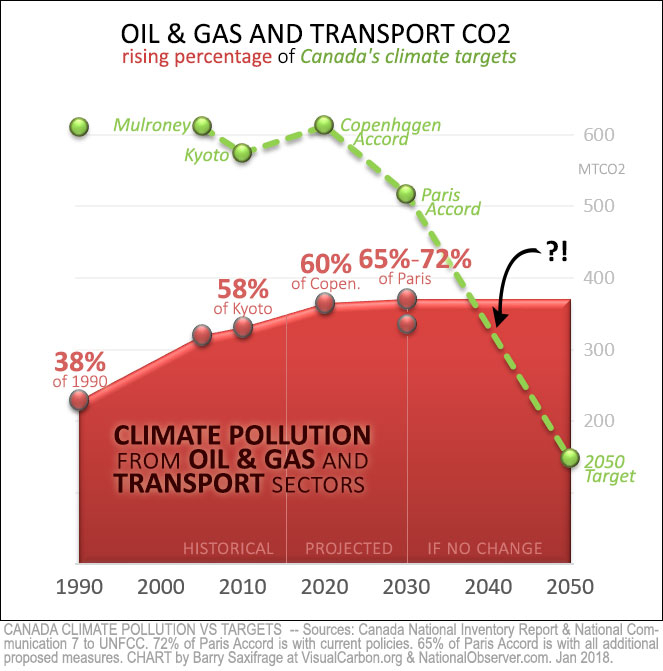
Back in 1990, Oil & Gas and Transportation emitted 38 per cent of the nation's climate pollution.
Since then these two sectors' combined emissions have kept rising even as we made commitments for stronger climate targets.
As you can see in the chart, the result has been that they capture an ever larger share of our climate targets:
- 53% of our 2005 target
- 58% of our 2010 Kyoto target
- 60% of our 2020 Copenhagen target
- 72% of our 2030 Paris target under current policies; 65% if all proposed polices in the Pan-Canadian Framework and elsewhere get enacted on time and work as well as advertised
By continuing to drag our feet towards the low-carbon future, we've allowed pollution from these two sectors to eat up ever more of our nation's safe climate budget — leaving less and less room for the rest of the Canadian economy.
At the rate we are going, it won't be long before these two sectors alone exceed Canada's entire budget for a safe climate.




Comments