Thank you for helping us meet our fundraising goal!
Death and decay are winning in Canada's vast managed forest lands. And this victory is unleashing a rising flood of climate pollution. Put simply, our forests are dying and being cut down faster than they can grow back.
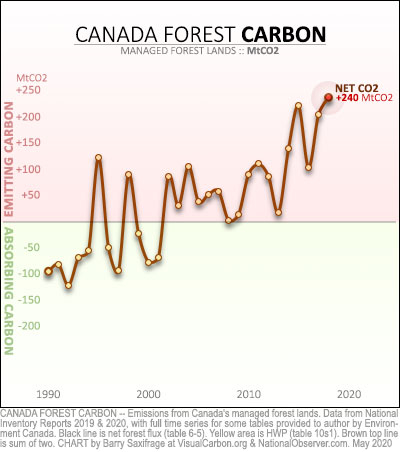
In 2018, the flood of CO2 pouring out of them reached record levels, at nearly a quarter billion tonnes of CO2 in a single year. That's more than Canada's once biggest climate pollution source — the oil and gas sector — emitted that year.
Sadly, this isn't a short-term aberration. The long-term trends are relentlessly grim. They show that our forests switched from much-needed CO2 sinks into dangerous CO2 emitters more than a decade ago. And what started as a trickle has grown into a flood of CO2 pouring into our atmosphere.
That's all according to the latest forest carbon data in Canada's recently released National Inventory Report (NIR). To illustrate the speed and scale of this unfolding crisis — and the role logging is playing in it — I've created a series of charts from this latest data.
The great CO2 flood of 2018
Canada's managed forests are enormous. They span the continent from the Pacific coast to the Atlantic Ocean, and cover an area larger than Germany, France, Spain, Italy and the United Kingdom combined.
As all these billions of trees grow, they breathe in CO2 and strip off the carbon to construct new wood. When the wood rots or get burned, that carbon gets reoxidized into CO2 again.
If there is more growth than decay, the forests are net CO2 absorbers ("carbon sinks"). If decay wins out, the forests emit CO2 ("carbon sources").
Canada reports this net CO2 balance each year in the NIR. That's the line on this first chart.
As you can see, our huge managed forests used to be huge CO2 sinks. During the 1990s, they were able to absorb and store hundreds of millions of tonnes of CO2.
But the data shows that this crucial carbon sink has disappeared. Instead, our forests transitioned to being net CO2 emitters more than a decade ago. And in 2018, they emitted a record 240 MtCO2. That's more than any other sector in Canada. In fact, our managed forests were the largest emitters of greenhouse gases in Canada for three of the last four years in the NIR data.
What's causing such a dangerous surge in emissions? And what role is logging playing in it? To answer these questions, we need to dig a little deeper into the data.
A tale in two parts
Canada reports forest carbon in two parts:
- Net CO2 from forest growth versus decay
- Additional CO2 emitted by harvested wood
My next chart shows both.
The first part is shown by the bottom black line. This is the annual CO2 balance between growth versus all forms of decay except from harvested wood. Major decay sources include wildfires, insect kills, droughts, and some logging impacts, such as slash burning and exposed soils.
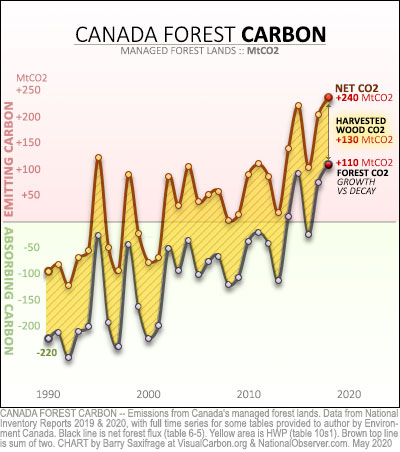
As you can see, these forces of decay have been gaining ground for decades. And the data shows that in extreme years now, death and decay are winning outright, tipping the forests into net emitters.
And that's before we add on Part 2 — the additional CO2 emitted by harvested wood (the yellow area).
Harvested wood CO2 is often a source of confusion. All harvested wood will turn to CO2 eventually. But not all of it does so in the same year it was logged. International climate rules require countries count it all. But there are options for when to count it.
Canada used to count it all in the year the wood was cut. As a result, the harvested wood CO2 numbers listed in older NIRs indicated how much wood got logged that year. This showed the amount of future CO2 locked in by that year's harvest.
A couple years ago, Canada switched to reporting wood CO2 in the year it got emitted back into the air. That's a smaller number, because about a quarter of the wood is in long-lasting products, such as building materials, that haven't rotted yet. Overall, this change retroactively shifted 2,500 MtCO2 from Canada's current and past books onto the future books for Canadians to deal with later.
All charts in this article show this new official "when emitted" number. (Readers wanting more details on this change and its generational burden-shifting can find them in my recent forest carbon explainer.)
The chart above now lets you see the role of harvested wood versus everything else. For example, the 2018 record was the result of all other forms of decay emitting 110 MtCO2 more than new growth absorbed — plus the additional 130 MtCO2 emitted by the burning and decay of harvested wood products.
What this chart also shows is how large the swings in the data can be from year to year. For example, a big wildfire year can create a short-term spike. When confronted with data this "noisy," scientists and policymakers rely on long-term averages to better see and understand the underlying trends.
Visualizing the long-term trends
My next chart shows these underlying trends.
In this chart, I've faded out the annual lines and charted their 10-year running averages on top. Each point on these trend lines shows the average over the 10 years leading up to it.
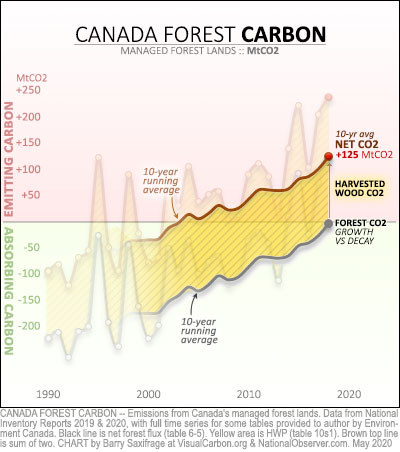
As you can see, the transition of our forests into super-emitters isn't a short-term aberration. It's a long-term trend that has marched consistently upwards over decades.
The lower black trend line shows that back in the 1990s, the forests were healthy enough to absorb an average of 175 MtCO2 more each year in new growth than they lost to all forms of decay — except from harvested wood.
But now this forest sink trend line has hit zero — the tipping point. That means the net CO2 balance over the last 10 years has been zero. The vital carbon sink at the heart of our enormous forests has vanished.
As I explained in more detail in my recent forest carbon explainer article, the primary driver of this dangerous trend has been increasing droughts, wildfire and insect outbreaks — combined with poor land use actions. Humans have been turbo-charging these trends via our fossil-fuelled climate disruption. And the best science says that droughts, wildfires and insect kills are all expected to grow worse in Canadian forests until climate change is brought under control.
And once again, sitting on top of this black line is the additional CO2 emitted by harvested wood (yellow area). This amount has stayed fairly consistent over the decades, with the 10-year average ranging between 127 MtCO2 and 140 MtCO2 in emissions per year.
That's a huge amount of CO2 for any sector to be emitting.
But, in the past, our forests were healthy enough to grow back as much wood as we cut out of them, and more. That meant the harvested wood was considered "carbon neutral."
Unfortunately for our logging industry — and our future climate safety — our faltering forests can't provide that essential service anymore.
Logging more than grows back
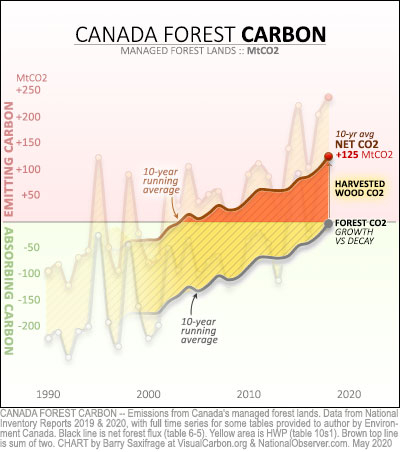
As these trend lines make clear, our logging levels started to exceed what our faltering forests could regrow ("offset") back in the early 2000s.
I've highlighted in red the amount of harvested wood CO2 that exceeded what the forests could absorb.
All that excess CO2 has been accumulating in our atmosphere, fuelling the climate breakdown. Just like the CO2 from our fossil fuel burning.
What started as a trickle has grown into a flood of CO2.
The total so far — the entire red area — exceeds one and a half billion tonnes of CO2. And the 10-year average is now up to 125 MtCO2 emitter per year. That's also a record set in 2018.
To put these emission numbers into context, let's compare them to the emissions from the rest of Canada's economy.
Rocketing past other sectors
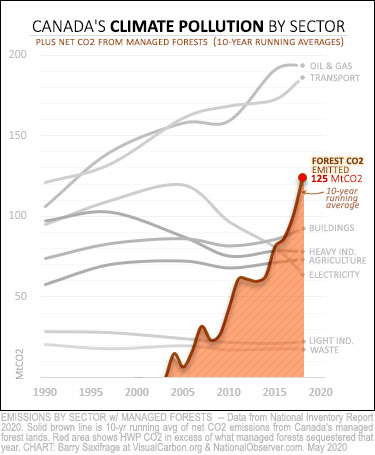
The grey lines on this next chart show the annual emissions from all the other Canadian sectors.
The brown line is the same 10-year running average for forest CO2 we discussed above.
It looks steeper on this chart because I've stretched the Y axis a bit to allow you to visually separate the other sector lines.
Emissions from our managed forests have already rocketed past most other sectors.
Their long-term average is now twice as much as what Canada's entire electricity sector emits.
And individual extreme years — like the record 240 MtCO2 emitted in 2018 — are literally off this chart.
Canada's total — accounting versus atmosphere
As a final comparison, let's look at how rising CO2 from our managed forests impacts Canada's total emissions.
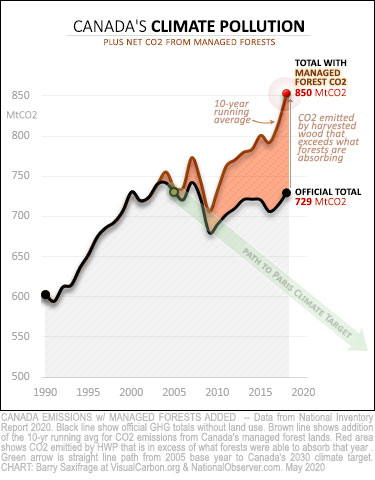
The black line on this chart shows Canada's official climate pollution total. It includes all sectors except the land use sector (which contains managed forests).
The falling green arrow is the path to Canada's climate target under the Paris Agreement.
And the rising brown line shows Canada's total emissions when our managed forest CO2 is included. This line shows how much is actually ending up in our atmosphere, fuelling the climate crisis.
And — critically — we are in control of all the emissions on this chart.
That includes the entire red area showing managed forest CO2. We could reduce this back down to zero by limiting our logging to what our forests can reabsorb each year. If we want to continue logging at current high levels, we will need to restore the carbon sink in our forests or find another way to offset the huge emissions of CO2 from our harvested wood. But we need to do those things anyway to achieve "net zero" in all other sectors of economy.
The climate science is clear that the path to a safe and sane climate future requires us to eliminate all sources of excess CO2, regardless of origin.
So far, however, Ottawa has responded to this emerging CO2 threat by trying to push this rising new flood of CO2 off the books. To do this, they've had to roll out a series of big and controversial changes in how they account for forest carbon.
But the atmosphere and the laws of physics don't care what kinds of creative accounting we try. They only react to the total amount of CO2 accumulating in the air. And in Canada, total emissions of CO2 are not going down as promised and as required for a safe future.
They aren't even flatlining-to-failure as our official numbers say.
They are rising dangerously fast.
We control it all. We need to start lowering our rising flood of climate pollution while we still can.



Comments
Excellent Article. It helps a layman understand the sources of increased carbon.
Canada is a exporter of many different products to the US and the world.
Wood products are a large export to the US and in many cases come under fire from the Forest industry in the US.
It would be interesting to see a similar comparison for the US.
Why the question. If Canada harvested and produced wood products for our own use and not the US, how would that change our carbon footprint. What happens to the US carbon footprint?
Many questions are raised after reading this article. Not enough answers.
Thanks for the comment. Here's some more info. The IPCC carbon accounting rules require all countries to count the CO2 from all the wood they harvest regardless of where it gets used. So Canada has to count the CO2 for the wood we export. The flip side is that we don't count the CO2 from the wood we import.
This is opposite from how fossil fuel CO2 is accounted, and so can be confusing. And it means that with wood CO2, the only way to reduce it in Canada is to either restore health of forests so they can re-absorb as much as is cut...or cut less.
Interesting article but do question some of the information. There is no mention of the required replanting of trees after logging. Is counted into the data?
Severely question the 25% usage of a tree into long term products. How are paper products classified into this formula considering recycling programs?
Another point that totally wrong is to say the forest is dead after logging. The cut blocks are more diverse and provide plenty of food for wildlife while they grow back.
Good questions. Here are some answers. The data is all from Environment Canada. There are two parts.
One part is the growth vs decay balance in the forests. They say this data includes the impacts from wood harvesting including replanting, slash, exposure of soils, and lots more. They get data from hundreds of sources including logging industry, govt forestry divisions, satellites, surveys and more.
The second part is harvested wood. They say they use industry stats to break up harvested wood in various categories that include burning for energy, paper and a variety of solid wood products like panels and dimensional lumber. Each of these products has an average "half life" in their calculations. (see tableA3.5-7 in latest NIR). For example, wood exported to USA and made into paper there has a "half life" of 3 years. That means that in 3 years, half will have rotted or burned and turned to CO2...in another 3 years half of what remains will have turned to CO2...and so on. They calculate this for all product types from all regions the wood is exported to. This is documented in NIR. If anyone thinks they have faulty numbers on product mix and half life I think they should make that known. It is outside my area of expertise.
The final point about 25% of a tree being put into long-term products is a rough way of saying that 25% of what has been logged so far has not turned back into CO2 yet.
Hello Ray, it takes about 30 years after logging before a forest starts storing carbon again. Until then, decay processes that emit carbon prevail. This of course applies if the planted trees grow well, which is not always the case. Here is a paper that explains it well: https://can-bv.ca/wp-content/uploads/2019/03/Pojar-7mythsfinal-2019-sma…
It's useful to distinguish between 1) forests/forestry, which recycle carbon already in the carbon cycle, and 2) fossil fuel extraction and combustion, which liberate and add long-sequestered carbon to the carbon cycle.
Yes, the IPCC accounting is different for land carbon (LULUCF sector) for that reason. However, Canada has said -- in Copenhagen and Paris targets -- that it plans to use forest carbon "credits" to "offset" additional fossil fuel CO2. And lots of other nations, industries and individuals are using forest carbon "credits" to "offset" fossil fuel emissions as well. That's a key method behind "net zero" for many.
Amen.
Thank you so much for gathering, analyzing and organizing so many statistics and facts, and turning them into clear, easily understood charts.
I expect I'm not the only Canadian who appreciates the clear view past government-speak and industry spin. Indeed, your work constitutes a service to humanity.
Thanks for letting me know this article was useful to you. In an ideal world the government would present even the "inconvenient" data in a way that was easy for the public understand and evaluate the big critical trends we all are facing. In the meantime it's up to those of us who care about the emerging climate threat to try to fill the gap.
What does managed forests even mean? They seem very unmanaged to me because I live in an area surrounded by clear cuts that we are assured have absolutely nothing to do with rivers running tan coloured from run off and the prevalence of landslides on these same slopes. I can’t imagine why they, the companies involved, expect us to believe such nonsense.
Fifty years ago, when I attended UBC and had some forestry professors lecture in my Zoology classes, they said that 20 years before, forest harvesting practices were primitive and problematic, but modern management had put them on the right path.
Then, 20 years after that, the forest managers (I was friends with some) said that 20 years before, their practices weren't that good, but they'd solved the issues, and all was well and would conitnue to be.
I called this the "Twenty Years Ago" song, and it's been going non-stop since at least 1970. This great article proves that all the Canadian forest-management singing in the world hasn't changed the fact that our forest-management practices sucked then and continue to do so. The measures needed to do better, for long-term forest health, were never a mystery, but making the "right" noises has always meant more than doing the right things.
Hi! Interesting article! I am wondering about the use of forest products instead of very CO2 intensive concrete etc in construction? Is some of teh CO2 increase here coming from reduced CO2 in these other sectors?
A very informative post, Barry. Kudos.
There are several ways to manage a forest. Selection logging is not anything like clearcutting. Ontario’s Algonquin Park has a forest harvesting and management practice, but it involves merely thinning within well-defined restrictions, often using horses. Parts of Vancouver Island’s private forest lands (remnants of the original 8,000 km2 Esquimalt & Nanaimo Railway land grant) have been egregiously stripped and appropriately labelled “extinction” logging by some environmental organizations. There are many variations between these opposing practices. And, of course, what few old growth forests remain require a lot more protection than they currently receive. Protection and preservation is also a form of forest management.
I think there there are some parallels with agriculture, both in the all-too-common environmentally abusive models and in conservation and regenerative practices. Soil health is ignored in so many forestry and farming practices. Conservation tillage (i.e. no till) and the use of nutrient-fixing, carbon capturing plant species cover crops in farming has evolved as a superb way to not just achieve a carbon balance, but to bring that into a negative value where crops and soil absorb more carbon than they emit, even when accounting for emissions from machinery. Recent research from USask has calculated the effects there and the absorption rate was measured in the millions of tonnes CO2e. Moreover, farmers attain better yields from fields where soil structure and organic content has improved, and their expensive machines require less maintenance and fuel.
Making a similar regenerative jump into forestry seems like a very wise endeavour. Some forest lots in Europe are hundreds of years old but have always remained in continuous solid cover. Selection harvesting where a forest canopy is maintained, amending the soil with nutrient-fixing crops like alder and some herbaceous species, hydro mulching harvested patches with biosolids and sawdust pellets containing the seeds of nitrogen-fixing plants and so forth will likely work wonders to improve forest health. Logging a steep hillside bare is one of the more egregious emitters of carbon from the soil, and that is inevitably followed by erosion. This remains one of the stupidest forestry practices that continues today.
Understanding the effects of climate change on forests and adaptation measures like using drought-tolerant tree species where appropriate, and moving to a community forest trust system where forest management is taken from provincial ministry levels (they have overseen most of the destruction from their corporate pals for a century now, and that must change) to individual towns with municipal forestry departments to complement a regional parks system could work wonders and help both fight and adapt to climate change, and keep a limited number of forestry jobs intact in perpetuity.
It’s simple: if a tree is growing, getting bigger and not rotten on the inside—the vast majority of trees—then it is absorbing and storing CO2. Truly decadent forests that emit more than they absorb are very rare because stands are likely to burn or be harvested before they reach the point of decadence. The most decadent stands I’ve ever seen over 30 years working in the woods have been on the West Coast where it’s too wet for forest fires, and in sheltered valleys that don’t get much wind. For example, I saw an old, old western hemlock stand near Kitimat where every tree was hollow from the ground to the very top—which you’d never would have seen if there had been the slightest wind: they would have blown down long ago. That stand measured out to be 92% decay!—and yet it was at near normal stems per hectare for its age (several hundred years). I remember it because, really, those kinds of stands—the kind that emit much more CO2 than they capture—are so rare.
Old growth is naturally decadent to some extent. At climax these stands are about neutral in CO2 emission/absorption rates. In other words, the stand is barely growing and decay is advancing faster than growth—that is, it will eventually—baring any disturbance—start to emit rather than absorb CO2.
Conversely, younger stands are fast-growing and therefore absorbing CO2 apace while emitting very little CO2.
It’s a bit obscure to say managed forests are emitting more CO2 than absorbing. Most old growth is not really managed —that is, it’s never been logged (and on the West Coast, never been burned, either), never been replanted, fertilized, juvenile spaced or thinned. But it can be said to be in a managed area—meaning the mix of OG and new growth is being managed for retention, harvesting and regenerating—it doesn’t necessarily mean that every stand in the parcel is a managed stand.
Any stand that’s not old and decadent, or dying from disease, pests, fire or blowdown is, by definition, absorbing CO2. Most growing stands are thinning themselves out as grow to maturity, that is, weaker or shaded stems are dying and decaying. But in most stands (the exception might be very low nutritional sites) the young growth absorbs more CO2 than the mortality emits. At maturity the stand enters a relatively long period of sustained but slowing growth, without much stem mortality, while each tree puts on girth rather than height. Decay eventually sets in when stems get old, but in climax stands that are “on-site” (adapted to the environment) a steady succession of younger stems growing from below the main canopy replace decayed and dying stems as they die and fall, balancing out the emission/absorption ratio. As mentioned, it’s fairly rare for stands to have every single stem decayed to the point that its emitting CO2 with no understory replacements absorbing CO2.
The issue here is, I think, really about unsustainable harvesting: trees are being cut down faster than they can grow back. There’s nothing new about this in Canada. Depending on site conditions affected by clear cutting (drying and heating in summer and drying and cracking in cold winter winds) the naturally high CO2 sequestration of new, thrifty stands might be impaired. Many stands in the dry Interior of BC have been difficult to regenerate to the stand-defining stage of ‘crown-closure’ or shade-on-the-ground. Until satisfactorily restocked, these NSR sites will emit CO2 from rotting debris, stumps and roots left over from logging while the lack of growing regeneration (of trees) means not much CO2 is being absorbed. Granted, some of these sites remain NSR for many years, even decades, but they don’t—can’t—remain very high emitters for very long before the waste biomass has been decayed and emissions stop. However, once a growing stand is re-established, the area quickly become a net absorber of CO2 that far outstrips the decay of residual biomass.
NSR cutovers are a management problem, not a forest stand problem (In many cases, there is no stand to manage until one is artificially and arduously regenerated. It’s misleading to say “forest have turned into super-emitters.” If there’s a forest, it’s most likely an absorber (only the most decayed forests with no new growth emit substantial amounts of CO2–and these stands are fairly rare). If there’s a regenerated forest that’s growing it is both managed in the stand-management sense—not the licence or regional-management sense—and also absorbing CO2.
Wildfire quickly releases the CO2 a forest took decades or centuries to sequester. If managed stands (not unmanaged OG in a management area or licence) burn, then yes, they become a “super-emitter”—but many wildfires burn unmanaged stands—that is, wild stands that have never been logged or thinned (Remind: these unmanaged stands might be in a so-called forest or land management area). Many wildfires in wild forests of the boreal and subarctic North are too remote to suppress and are left to burn all summer, sometimes through the winter and into the next year. From an economic point of view these stands will never be commercially viable—the quality of wood is too low, it’s too remote—and can only be called “managed” if the criterion includes CO2 sequestration—that is, it’s being “managed” to score sequestration credits only. But these aren’t really managed in the ordinary sense. Of course if they are included with commercially viable forests (which include virgin, unmanaged stands) and commercially managed stands (thinned or regenerated forests), then it might be—in a qualified way that a headline can’t quite express—regarded a “super-emitter” when if (or when) it burns.
The confusion, I think, is the definition of “managed”. As mentioned, there’s a difference between managed stands and managed forest lands: the latter may contain much, if not a majority of wild, virgin, unmanaged stands; the latter might, depending on the definition of management, also include forests that are not, nor ever will be managed on the ground by entries, harvesting or managed regeneration because of infeasibility.
Thus the more accurate assertion is that Canada’s forest lands, not the forests themselves per se, are not absorbing as much CO2 as they did or could do if satisfactorily restocked and growing and protected from wildfire. It’s not really a managed-stand problem, but a forest-land management problem: overcutting the sustainable regrowth and, in the way of a shell-game, including lands that are way out of reach of actual management in all but paper calculation and headline semantics.