Support strong Canadian climate journalism for 2025
Germany, the United Kingdom (U.K.), and Canada have a lot in common. All three crank out an economy that makes the global top 10. All three are members of the elite Group of Seven (G7) advanced industrial nations. And all three have a highly educated workforce.
But when it comes to acting on the planet’s metastasizing climate crisis, our European peers are in a whole different league. To illustrate just how far ahead they are, I’ve charted the climate pollution from all three since 1990.
Germany has cut emissions nearly in half
My first chart starts with 1990 emissions from all three nations. Those are the coloured dots on the left side of the chart. Germany’s emissions since then are shown by the plunging black line.
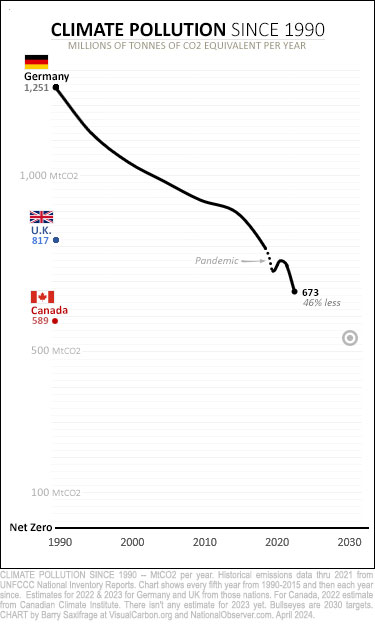
Germany’s economy is the world’s third- or fourth-largest — more than twice the size of Canada’s. Their population is also more than double ours.
So, it’s not surprising that back in 1990, they also emitted more than twice what we did in Canada.
Since then, however, they’ve cut their climate-destabilizing emissions nearly in half — falling to 673 million tonnes of CO2 (MtCO2) in 2023.
And they aren’t planning to stop there. Last month, the German government announced it is on track to reach its 2030 Paris Agreement climate target — an impressive 65 per cent climate pollution cut from 1990. The target is shown by the grey bull's-eye on the chart.
They are also working to clear a path beyond that to net zero by 2045. For example, last month, they rolled out a new US$25 billion industrial decarbonization plan aimed at some of their hardest to abate emissions.
The U.K. has done even better
The U.K. economy is the world’s sixth largest — one and a half times the size of Canada’s. They also have a lot more citizens than Canada.
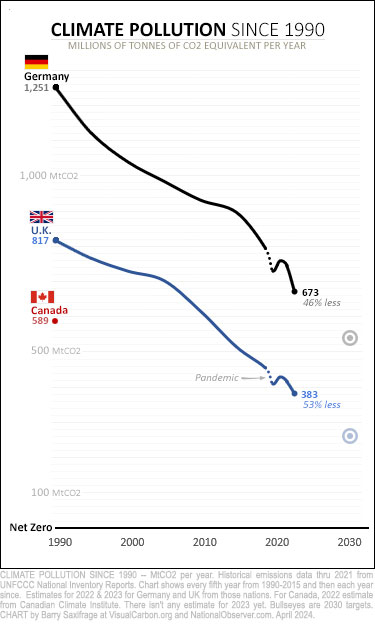
So, it’s also not surprising that back in 1990, they also emitted a lot more than we did.
Since then, they’ve cut their emissions by more than half. That’s the falling blue line on the chart. Their latest numbers show a drop to 383 MtCO2 in 2023. That’s a world-leading 53 per cent reduction since 1990. Heck, it’s even less than they emitted a century earlier — in 1880.
The British target for 2030 is even more aggressive than Germany’s — aiming for 68 per cent fewer emissions than in 1990. That’s within sight of net zero, as shown by the blue bull's-eye.
What really jumps out at me on this chart, however, is how consistently both Germany and the U.K. have cut their climate pollution decade after decade. That is a testament to strong policies, hard work and steadfast commitment.
As Canadians have learned the hard way, emissions don’t magically cut themselves.
Canada’s climate leadership?
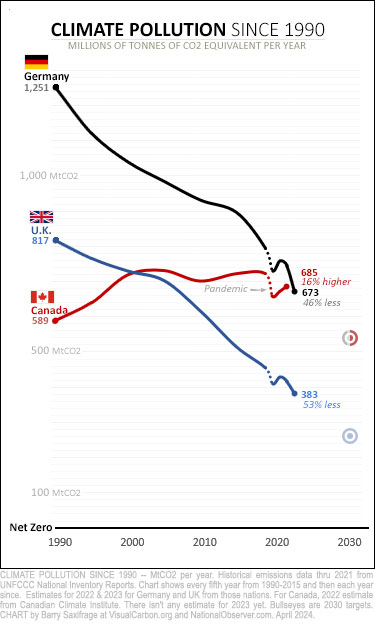
To see what Canada has done with emissions, I’ve added us to the chart as a red line.
Canada is the world’s 10th-largest economy. We have also been one of the world’s largest climate polluters, both in total and per person.
Way back in 1988, the Canadian government first pledged to cut our supersized emissions. Today, we emit even more, not less — nearly 100 million tonnes more.
In 2022, Canadian emissions rose to 685 MtCO2. That’s according to the most recent estimate available.
I suppose increasing emissions is a form of climate leadership — in a lemmings-off-the-cliff kind of way.
Back in 1990, at the start of the climate action era, the British were more than 200 MtCO2 behind us. They rapidly closed that gap and have since sprinted 300 MtCO2 ahead of us. The Germans were three times further behind us in 1990 —– a whopping 650 MtCO2 gap. But they, too, have closed the gap and are now poised to blow past us.
Looking at this chart, you might wonder where the British and Germans are cutting all those emissions. I was curious. To find out, I dug down one more level into each nation’s official National Inventory Reports (NIRs). Here’s what I found.
Sector by sector breakdown
My next chart shows the climate pollution changes in each economic sector.
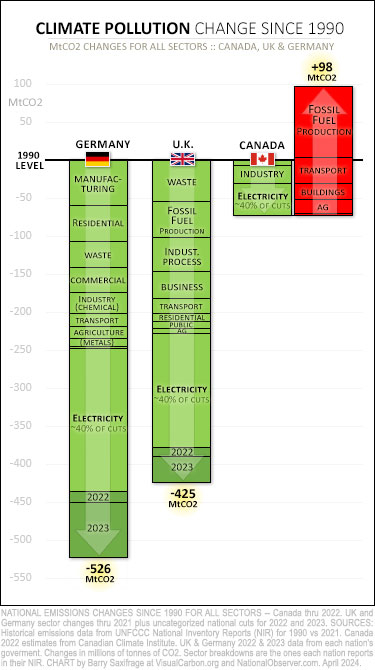
Green bars show sectors that reduced emissions since 1990. And the height of each bar indicates the amount reduced.
Red bars show sectors that increased emissions.
As you can quickly see, Germany and the U.K. have cut climate pollution in every sector. So, the short answer to the question of “Where they are cutting emissions?” seems to be “everywhere.”
When you reduce emissions in every sector, all those reductions add up to big numbers. The British efforts add up to cuts of 425 MtCO2; for the Germans, cuts of 526 MtCO2.
In contrast, Canada has increased emissions in most sectors since 1990. These increases also add up. In our case, our climate pollution increases have been more than our decreases. Failing to act effectively across most sectors has allowed our national climate pollution to rise by 98 MtCO2.
Before leaving this chart, there are two more things worth noting.
The first is the role played by Canada’s fossil fuel sector. In the chart’s upper right, you can see their big red bar. It shows that this sector increased emissions the most in Canada. That’s been a major factor in Canada’s climate failure, for sure. But as all those other red bars show, our climate failure runs a lot deeper than one rogue sector. To see why, just picture that chart without the fossil fuel sector’s big red bar on it. Where would Canada’s emissions be then? Yep, still above 1990.
A second takeaway from this chart is how similar the electricity sector’s role has been in all three nations. All three nations relied on their electricity sectors for their biggest emissions cuts. And in all three, those cuts accounted for roughly 40 per cent of national reductions so far. Going forward, however, the electricity sector will play a much smaller role. That’s because decades of decarbonizing it have cleaned up most of its emissions. At this point, the biggest pollution cuts will need to come from other major emitting sectors, like transportation, buildings and industry.
Per person
I’ll wrap up with a chart comparing the emissions per person in all three nations.
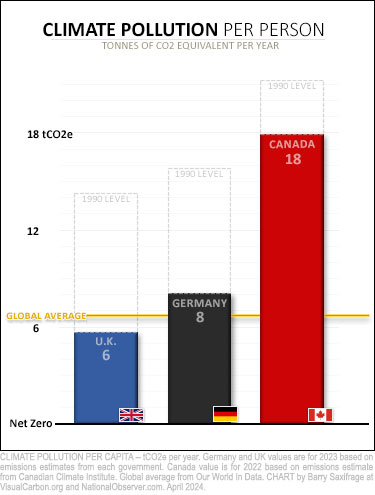
The British, shown in blue on the chart, emitted around 14 tonnes of climate pollution (tCO2e) per person back in 1990. Now they emit just six tonnes each.
That’s below the global average of around six and a half tonnes per person.
The Germans cut their per-person climate pollution in half — from 16 tCO2e in 1990 to eight tCO2e today.
Canadians have also cut emissions per person. But not very much. Currently, we emit 18 tCO2 per person each year. That’s nearly three times the global average.
What these charts show clearly is that it has been possible for nations with advanced economies — like Canada, Germany, the U.K., and other G7 nations — to significantly reduce their climate pollution. And as we’ve seen in detail, Germany and the U.K. have been successfully doing it for decades.
But not Canada.
I don’t know about you, but I’ve always believed that Canadians would be out in front, with the other climate leaders, sleeves rolled up, working hard to stop such an existential crisis from spinning out of control.
We should have started 36 years ago when we first made the promise.
But starting now is — by far — the best option we have left.


Comments
Hey, and Germany did it while shutting all their (radioactive tritium emitting) nuclear power plants!! Kudos for being world leaders on this one and showing all of us it's possible!
Don't forget about the far more prevalent and dangerous emissions from Russian gas and oil, not to mention coal. All are being diminished to one degree or another.
Very good information. I have one very big question though: the UK falsely claims that burning biomass for electricity is carbon neutral. It is not - burning wood is even more GHG heavy than coal and UK electricity production also leads to large scale destruction of forests in the US and to some extent in Canada. Barry I would like to see a comment from you about this - what is the impact of false "green washing" claims for these UK figures where 40% of their reductions are in electricity.
I have the same burning question. I don't want to instigate distraction from our own dismal performance in these past 30 years, but it would be good to see some of the finer print on accomplishments reported by other countries. In Britain, for example, the greenwashing abounds with respect to electricity formerly powered by coal and now by imported wood pellets at Drax, the largest power plant in the UK and also Western Europe. And when BC's chief forester, actively in charge of industry regulation, is then scooped up by Drax to work the other side of the industry, it does induce the urge to bring out the magnifying glass.
https://www.cbc.ca/news/canada/wood-pellets-bc-forests-green-energy-1.6…
https://www.cbc.ca/news/canada/wood-pellets-bc-forests-green-energy-1.6…
https://thetyee.ca/Analysis/2022/04/07/BC-Chief-Forester-Jumps-Multinat…
Now compare the provinces per capita emissions. Your lets blame all of Canada falls apart rather quickly.
What, because of the tar sands? But clearly, without the fossil fuel emissions we still suck.
I seem to remember Barry writing a research piece comparing emissions from provinces. His take was that Alberta and Saskatchewan are dragging the rest of the country down.
In fact, one statement from that article stuck with me. To paraphrase, Canada would be well on its way to meeting its Paris agreement commitments if it wasn't for AB and SK.
Though we like to chalk up our high average per captita emissions to cold climate and distance to travel, Scandanavia proves that these are not valid excuses. The majority of Canadians live in cities which are always clamouring for decent funding for transit from senior governments. But they, too, must assume their share of responsibility for higher per person emissions from suburban sprawl.
Density, even moderate, comfortable upzoning, has a markedly lower per person emissions profile than freeway-accessed distant subdivisions and makes public electric transit more feasible.
An attached townhouse has at least two fewer surfaces (mainly walls) exposed to cold outdoor air. Distances to work and shopping are less. Etc.
EVs would immediately address tailpipe emissions and this is a field that is evolving fast, especially in energy density, using more commonly available materials and the recycling of base metals. Ditto BEVs in the form of transit buses. EV battery tech morphing into large scale packs designed for massive grid storage is now a thing and is destined to have a huge positive impact toward replacing fossil fuels with electricity. And it arrives as transit projects and rezoning for denser communities come on stream more prevalently, if not at the ideal pace. The need for private transport (EV or not) diminishes as the transit-orientation increases in new and infill urban development.
What this tells us is that we need to work on making Canadian urbanism more efficacious and intercity transportation far less dependent on roads and fossil fuels. This can be done through policy and better funding even as politicians continue to ignore the blooming of oil industry emissions.
The emerging evidence indicates that global efforts in renewable solar and wind coupled with powerful batteries will catalyze the demand destruction of finite carbon fuels this decade. Our cities must follow suit with efficiency, but there already has been some progress on that front even if it's a little slow.
Check out Rethink X's paper: https://www.rethinkx.com/energy
The impact of building solar, wind and batteries to handle the darkest, most windless days means a system that will "overproduce" for the rest of the year. This supercheap abundant electricity can make decarbonizing all sectors inevitable.
Just Have A Think also posts weekly pieces about the energy transition and the climate emergency.
Transportation GHGs have increased almost as much as fossil fuel extraction & processing. And the blame for transportation failure is coast to coast.
What is missing for me in these analyses are "specific examples" of what was done in each sector to reduce emissions. What have the UK and Germany done that we don't do? There is not much to be learned from simply stating that these countries have dramatically reduced their emissions while Canada has not.
The large investments which the UK and Germany made in wind power have paid off, even allowing them to weather the loss of Russian gas exports. Past time for Canada to do the same for both wind and solar which we have in abundance.
Indeed.