Support strong Canadian climate journalism for 2025
Carbon pollution from oilsands expansion is radically undermining Canada's plan to fight climate change. On the present course, almost everything else in Canada would have to shut down for the country to meet its climate change targets.
- Accelerating climate failure — Oilsands expansion is devouring our national climate goals.
- Wildly unbalanced — Oilsands’ share of Canada’s climate budget is out of proportion to the relatively small contribution to jobs and GDP.
- Extreme actors — Canadians are outliers in both pace and scale of fossil carbon extraction compared to other countries.
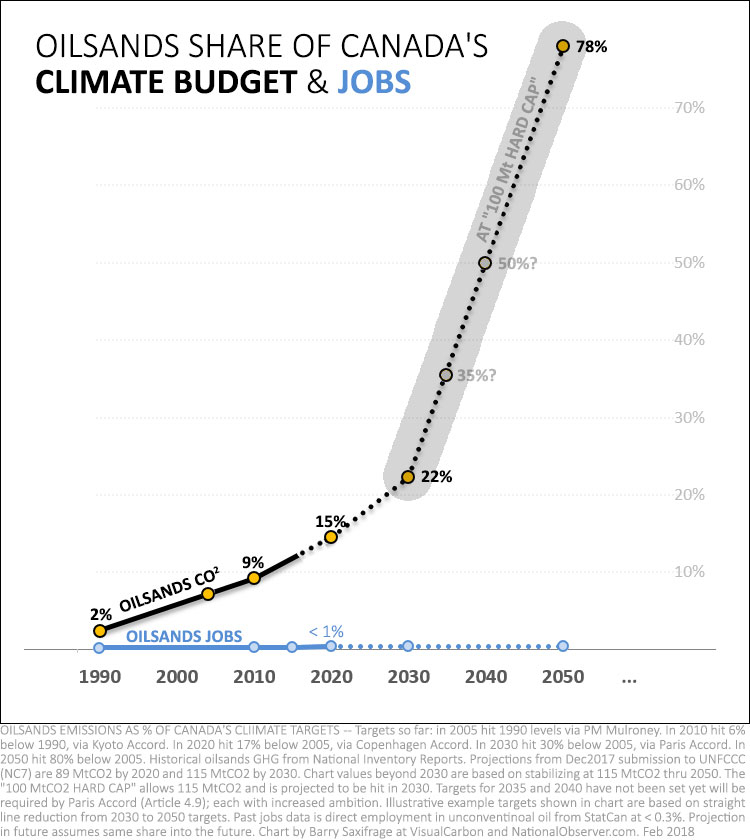
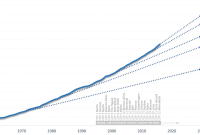
To illustrate the accelerating threat posed by oilsands pollution, I created the chart below. It shows the percentage of Canada's climate targets eaten up by climate pollution from Alberta's oilsands industry.1 As you can quickly see, the oilsands’ share keeps rising relentlessly. Back in 1990, oilsands pollution caused two per cent of our country's total. Since then it has accelerated upwards, grabbing:
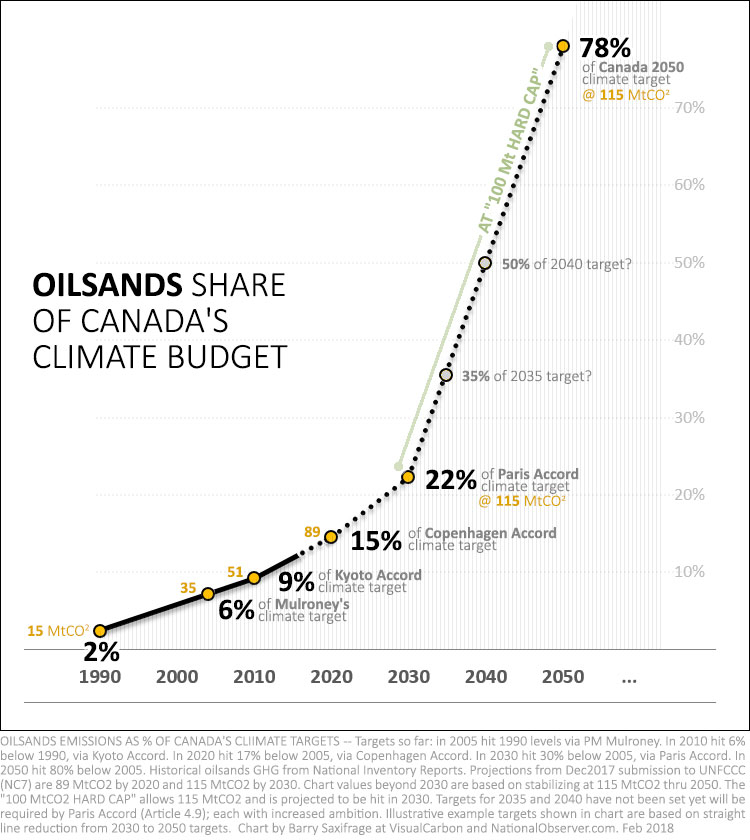
- 6% of Canada’s 2005 target set by the Mulroney government
- 9% of the 2010 target set by the Chretien government
- 15% of the 2020 target set by the Harper government
The oilsands industry is projected to expand another sixty percent by 2030. At that level, oilsands will grab:
- 22% of our first Paris Accord target, in 2030
- 78% of Canada's 2050 target
Both Stephen Harper's Conservative government and Justin Trudeau's Liberal government agreed to Canada's 2030 target. The latest projections, however, expect us over-pollute by 125 million tonnes of CO2.1b Rising oilsands pollution makes up two-thirds of that failure.1c
How much more of our nation's climate budget are we going to hand over to this single industry in a single province? Apparently, a whole lot more.
Oilsands 'hard cap' leaves nothing for rest of Canada
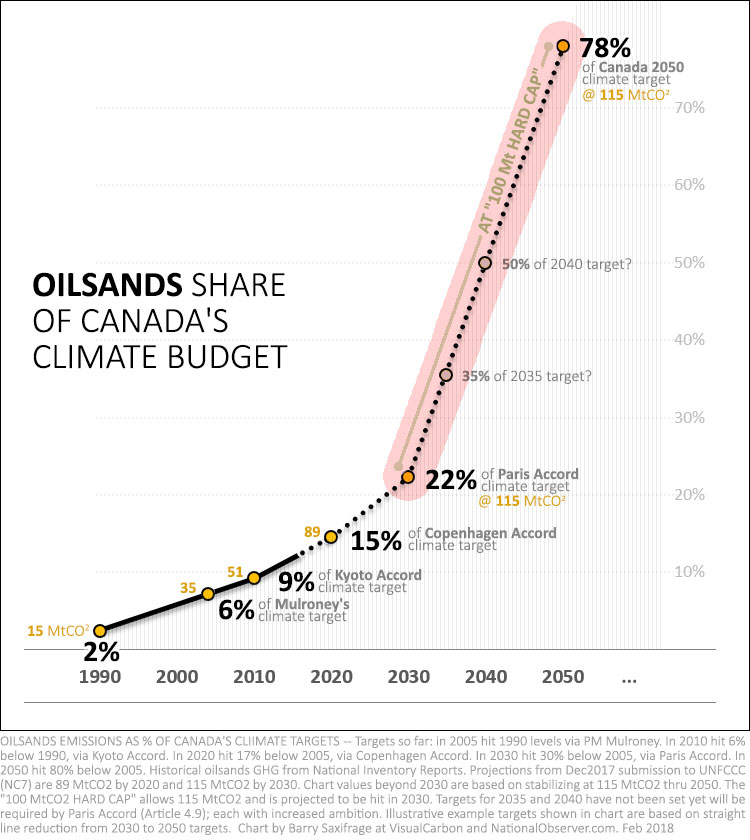
Alberta’s Notley government enacted a 100 MtCO2 “hard cap" for the oilsands. This cap allows oilsands climate pollution to surge another sixty per cent. Current projections show industry will hit that level around 2030.1e
This "hard cap" is being promoted as a key part of Canada's climate solution.
Decide for yourself....
Here's that same chart from above, with the "hard cap" highlighted in red. This cap allows oilsands pollution to rise to 115 MtCO2 — eating up nearly a quarter of Canada's climate target in 2030.1e
Continuing at this capped level, the oilsands would gobble up 78 per cent of our nation's climate target for 2050.
But we won't have to wait for 2050 for the train wreck. That's because the Paris Accord requires all nations to set increasingly ambitious targets every five years. To illustrate what that might look like for Canada, my chart shows straight-line targets for 2035 and 2040. In this scenario, the "hard cap" eats up a third of our national target within five years of kicking in. Within ten years of kicking in, it demands half.
Instead of being part of a climate solution for Canada, Alberta's "hard cap" allows just one industry to consume our nation's climate goals and obligations. The trend is the threat.
Oilsands jobs, GDP and CO2
What about the argument by bitumen expansionists that the oilsands industry is just too critical — in jobs and GDP — to require reductions like other businesses must make in their climate pollution?
I created the chart below to help illustrate the relative size of each. It lets you compare the percentage of Canadian jobs, GDP and climate pollution from the oilsands industry.
CO2
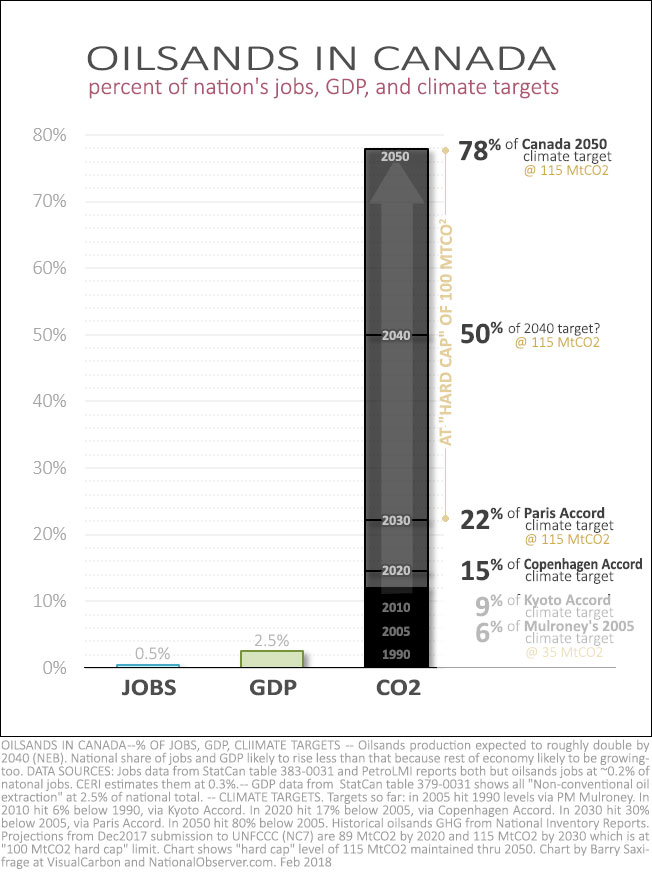
The black bar on the right shows the same info as my first chart — the percentage of our country's climate goals eaten up by oilsands pollution over time.
JOBS
The blue bar on the left shows the percentage of Canadian jobs created by the oilsands industry. Estimates by Statistics Canada, Canadian Energy Research Institute and PetroLMI all put direct employment in oilsands at well below one half of one per cent of national employment.2
GDP
The green bar in the middle shows the percentage of GDP produced by the oilsands. Statistics Canada puts the direct contribution at around 2.5 per cent of Canadian GDP today. 3
Does this seem like a fair and workable balance to you?
Heading into the future, this imbalance is likely to grow ever more extreme. The oilsands CO2 share is set to surge dramatically… but the oilsands’ share of jobs and GDP isn't likely to shift much at all. That's because, according to the National Energy Board, the overall economy is projected to expand at roughly the same rate as bitumen production.3c
In fact, when it comes to Canadian jobs, the oilsands contribution seems more likely to fall even if bitumen expansion continues.
'De-manning' the oilsands
If Canada is going to be forced to abandon our climate hopes and commitments to support job creation in one of Alberta's industries, then shouldn't that industry at least be required to crank out some amazing job growth relative to the rest of the national economy?
Sadly, that seems unlikely.
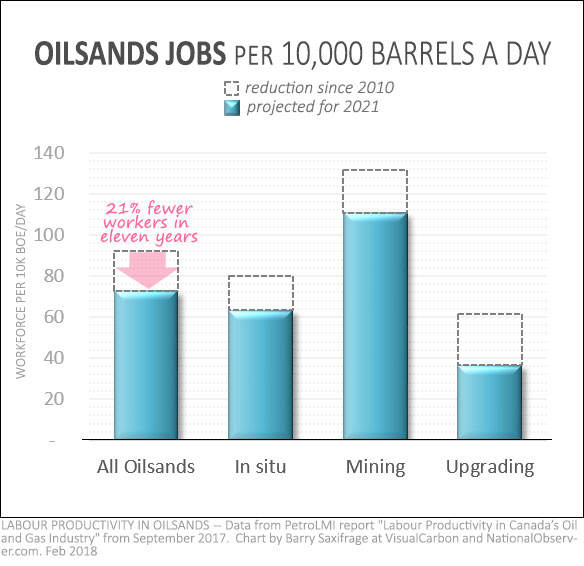
Instead, the oilsands industry is aggressively pushing to reduce the number of workers needed per barrel. "Increasing labour productivity," to use industry’s phrasing.
Take a look at my chart on the right. That data comes from PetroLMI's recent report on "Labour Productivity in Canada’s Oil and Gas Industry." It shows the oilsands industry on track to reduce workforce by 21 per cent per barrel between 2010 and 2021.2c
All sectors of the industry — In situ, mining and upgrading — are significantly reducing workers per barrel.
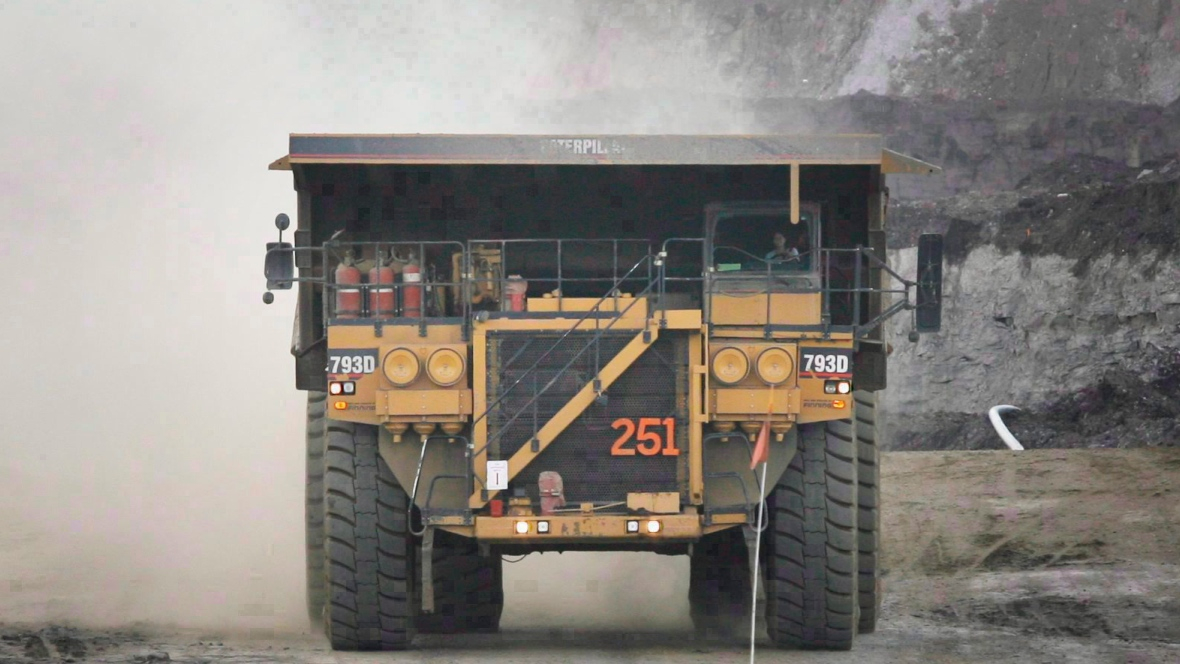
Longer-term workforce reductions, via automation, are rolling out as well. In one example, Suncor Energy recently announced they are shifting to driverless trucks. In another example, flying drones are reported to be expanding rapidly.
A Cenovus Energy executive told investors: "For new next-generation SAGD projects, it’s a longer-term vision to move towards zero manning in the field … If we can put production systems on the seabed, we can de-man oilsands."
Even if oilsands manage to maintain their current share of Canadian jobs, the massive imbalance with their climate pollution will continue to grow. To illustrate, here's a version of my first chart with oilsands jobs added. It shows what happens if the oilsands maintain their share of jobs into the future.
But isn’t everyone else doing the same thing?
The final argument I hear from the bitumen expansionists is that Canadians are just doing the same kind of fossil carbon extraction as our peers. What about those Americans extracting all that fracked gas, shale oil and literally blowing off mountain tops to carve out the coal underneath?
Good question. Let's take a look.
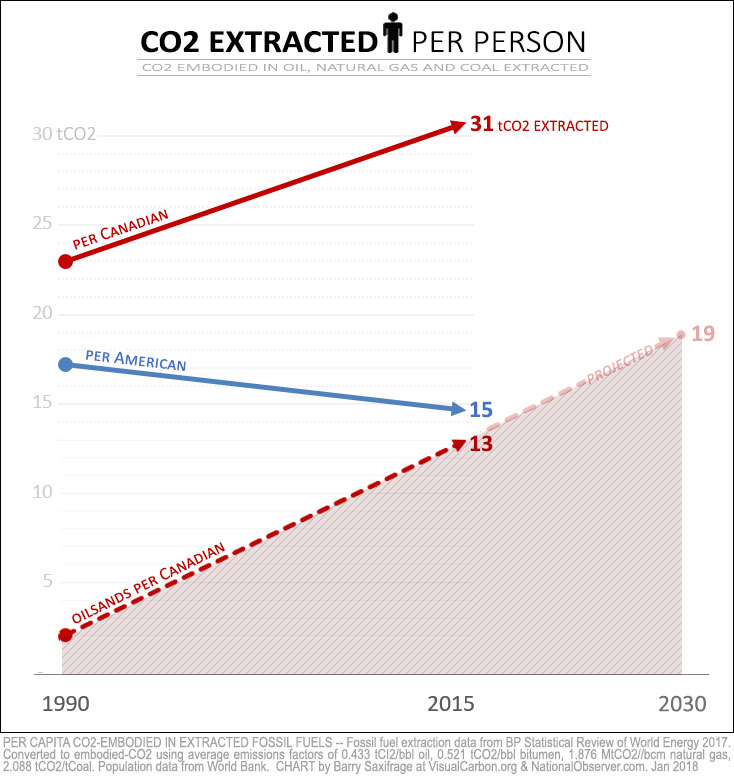
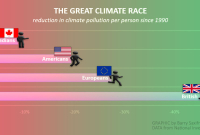
My final chart shows how much fossil carbon is extracted per person in each country. This is the combined total from all coal, oil and natural gas, based on data from BP's Statistical Review of World Energy.4
Back in 1990, Canadians and Americans weren’t far apart.
Since then, however, as the climate crisis has unfolded, we've headed in opposite directions.
Americans have slightly reduced how much climate pollution (fossil carbon) they dig up per person. In contrast, Canadians have dramatically increased ours. In fact, we now extract twice as much per person as the Americans.
The chart also shows that the Canadian surge has been caused by explosive expansion of Alberta's oilsands industry. To appreciate how radical this surge has been, compare just the amount of fossil carbon we're extracting from the oilsands to the amount the Americans are extracting from all fossil fuels: oil, natural gas and coal combined.
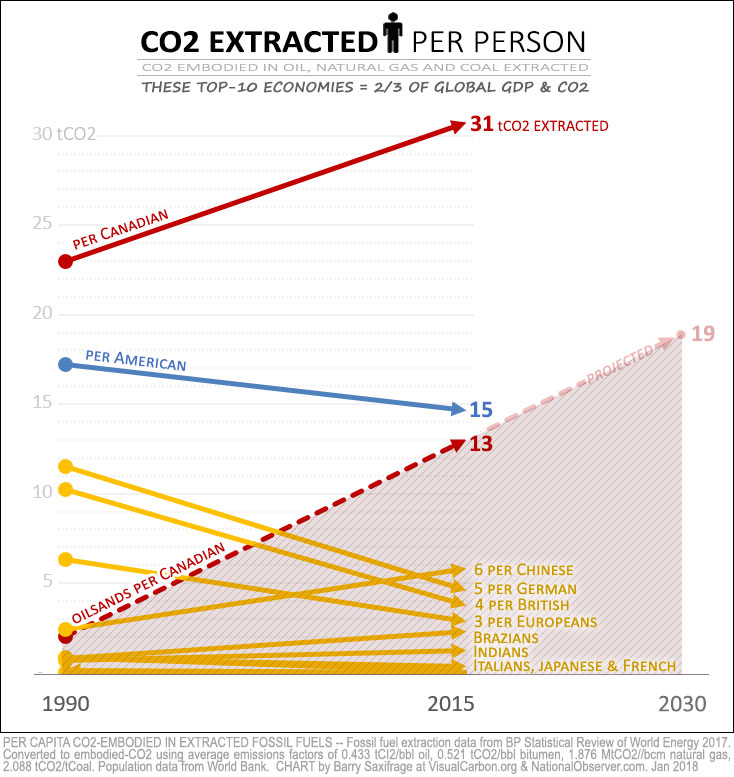
Finally, let's see how we compare to the rest of the world's top 10 national economies plus the European Union. This group produces two-thirds of global GDP and global climate pollution. It’s where the world's political, technological and financial power is concentrated. Any solution to the climate crisis will need to come from this group.
As this chart makes clear, Canadians have become extreme carbon extraction outliers. There is nothing normal about the pace we have been pulling oilsands carbon out of the ground. It's been a frenzy. And, far from putting on the brakes, Alberta and the federal government are hitting the gas.
As we saw in detail above, it is exactly this expansion of the oilsands industry that is driving Canada’s climate failure. Continuing this bitumen expansionist path will lock in climate failure for the next generation as well.
Most of Canada doing its part
Fortunately, this data also shows that there is another, more hopeful, path available to us. It shows that most of Canada is doing its part to meet our climate goals. Our country's main stumbling block is the rising share of oilsands pollution. And this data also shows that we aren't forced to keep expanding oilsands pollution. The potential jobs added by oilsands expansion are an extremely small slice of our nation's employment. And we can see that other major nations are maintaining strong economies without expanding how much fossil fuel they dig up per capita. Just look at the Americans and the British.
---------------------------------------
NOTES AND SOURCES
1. Canadian climate pollution
1a) Canadian Climate targets:
- Canada's 2005 target set by PM Mulroney's = 1990 levels.
- Kyoto Accord 2010 target set by PM Chretien = 6% below 1990.
- Copenhagen Accord 2020 target by PM Harper = 17% below 2005.
- Paris Accord 2030 target set by both PM Harper and PM Trudeau = 30% below 2005.
- Canada 2050 target set by PM Trudeau = 80% below 2005.
1b) Canadian GHG projections are from Canada's NC7 submission to UNFCCC (Dec 2017). Table 5.18 shows projected 2030 emissions will be 125 MtCO2 above 2030 climate target (counting "additional measures"). If international offsets that Ontario and Quebec plan to buy from California are allowed to be counted towards Canada's target then our national net emissions are projected to be 65 MtCO2 above our 2030 target.
1c) Historical oilsands GHG data taken from Canada's National Inventory Reports. Oilsands emissions were 35 MtCO2 in 2005 (Canada's base year for climate targets).
1d) Projected oilsands GHG data from Canada's NC7 submission to UNFCCC (Dec 2017). Table 5.9 lists these as 89 MtCO2 by 2020 and 115 MtCO2 by 2030. This puts oilsands emissions 80 MtCO2 above 2005 levels in 2030.
1e) Alberta's "100 MtCO2 hard cap" on oilsands exempts some classes of emissions such as from co-gen and new upgrading. Canada's NC7 submission projections are for 115 MtCO2 of oilsands emissions in 2030. This falls under the cap because 99 MtCO2 are emissions that fall under the "capped" category, while 16 MtCO2 of oilsands emissions are exempt from being included in the cap.
2. Canadian jobs
2a) Canadian jobs data from StatCan table 383-0031 = ~18.5m jobs in 2016.
2b) Oilsands jobs as share of national jobs from three sources:
- 0.2% share via 28k jobs in 2016 from StatCan table 383-0031
- 0.2% share via 30k jobs in 2016 from PetroLMI Labour Productivity in Canada’s Oil and Gas Industry report
- 0.3% share at 64k jobs in 2016 from CERI Canadian Oil Sands Supply Costs and Development Projects (2016-2036)
2c) Oilsands labour productivity changes from PetroLMI Labour Productivity in Canada’s Oil and Gas Industry report shows 108 BOE/d per employee in 2010 rising to projected 137 BOE/d per employee by 2021.
3. Canadian GDP
3a) Canadian GDP data from StatCan table 379-0031
3b) Oilsands GDP as share of national GDP from StatCan table 379-0031, "Non-conventional oil extraction" at 2.5% of national total.
3c) Canadian GDP & oilsands production projections thru 2040 from National Energy Board (NEB) Canada's Energy Future 2017 report. Reference case projects a 78% increase in oilsands production and a 56% increase in Canadian GDP over that time.
4. Extraction of fossil carbon. Quantities of fossil fuels extracted from "BP Statistical Review of World Energy" . Oilsands extraction levels from Canada's national inventory reports. All converted to embodied-CO2 using average emissions factors of 0.433 tCI2/bbl oil, 0.521 tCO2/bbl bitumen, 1.876 MtCO2//bcm natural gas, 2.088 tCO2/tCoal. Population data from World Bank.



Comments
A huge Thank You to the staff of the National Observer for bringing the true impact of continued Fossil Fuel extraction to the public. Your information let’s us stand at the barriers with conviction based on real facts.
It’s so very disheartening when our own Government repeats the lies and spin of the Oil companies and continues the subsidies.
Thanks Again
Tom
SUBSCRIBE to TRUTH. Pass it on.
Get it with the National Observer.
Ditto - thanks
We all appreciate hearing this, Tom. I watch Barry work for weeks on his columns, ploughing through pages and pages of documentation and studying the science. Then he shifts the data into these beautiful charts. Next is the big challenge of presenting it in a compelling narrative that is accessible to people who aren't steeped in the science. His skills are very unique and I'm always proud to publish his work.
I would like to understand what Mr. Trudeau's response would be to this data, which I have seen this news organization report on previously. Was this data put to Mr. Trudeau in the course of the recent interview? If not, can we please seek a response from him?
This situation essentially nullifies the actions of every Canadian citizen who takes it upon themself to change their way of life to try to address climate change responsibly. Why is our federal government okay with one industry erasing the investments and efforts of the vast majority of Canadians? Because there are certainly increased costs and effort required for individuals investing in a more sustainable way of life, to try to protect their children and grandchildren from the devastation of our planet and destabilization of our climate. Why, Mr Trudeau and Ms Notley, is it okay for one industry, known to be the source of substantial harm, pollution, and risk; already vastly enriched along the way through the privatization of public goods; to take home all the winnings, while the rest of Canadians pay for it, either in terms of having their sustainability efforts nullified, or by having their homes and livelihoods put at risk by one type of climate-change-caused weather disaster or another, be it flood, wildfire, torrential downpour, coastal erosion or permafrost melt?
Mr Trudeau and his cronies talk about bringing a "balanced" approach. This completely ignores decades of severe imbalance, brought about by excessive reliance on the fossil fuel industry and its products, all amplified and drawn out by the wilful suppression of information and evidence concerning the harm to our planet from these very industries. Mr Trudeau's "trade-off" does nothing to produce balance, but just trades off the lives and security of our children and grandchildren for the same old crap arguments we've bought into for the past 50 years. And it's not like we don't have the knowledge and technology to initiate a dramatic shift in our energy infrastructure and growth strategy, to favour renewables instead. We have an alternative, and every bit of science tells us we should take it, and instead our elected officials double down on the same harmful strategy that has brought us all to the brink already.
What safe planetary haven does Mr Trudeau have in mind for his children, when the world is destabilizing all around them, due to his weak efforts, and the complicity of people like Ms Notley in trading off life and security for popularity and money? Or does he simply not care to investigate and understand the harm he is perpetuating, to their future?
This is a thoughtful response and these are great questions. Much to consider in what you've said.
It just shows once again that the Trudeau government is working hand in hand with the fossil fuel industry.
These stories and graphics are extremely important in teaching and communicating about the threats we're facing. Thank you.
Thanks, Paul. Please share them widely. It's getting harder with the changes Facebook and Google have made to their algorithms for us to connect these important pieces with the millions of people who need to see them. If each of you would share through your social media channels and email to your friends, well, I know that would be asking a lot, but that's how it could happen.